Full Report
The numbers behind PT Bangun Kosambi Sukses Tbk: as-reported financial statements and company metrics for FY2021–FY2025, traced to the source filings, opened with the share-price history those statements have to justify. Every linked figure opens the exact page of the filing it was printed on, with the statement row highlighted. Amounts in Rp billion unless noted.
Reading notes: All figures are in Rp billion, converted from the thousands of Rupiah printed in the filings; per-share amounts are in full Rupiah exactly as printed. Citation filings: FY2025 and FY2024 from the audited statements for the years ended 31 December 2025 and 2024; FY2023 income statement and cash flow from the audited statements for 2024 and 2023; FY2022 and FY2021 income statement and cash flow from the audited statements for 2022 and 2021. Balance sheet basis: FY2023, FY2024 and FY2025 are the three columns (1 January 2024, 31 December 2024 restated, 31 December 2025) printed in the FY2025 audited statements; FY2022 and FY2021 are the restated 31 December 2022 and 1 January 2022 columns printed in the FY2023 audited statements, which split customer advances between current and non-current on the same basis as later years. FY2024 comparatives were restated under the pooling-of-interests method for the January 2025 acquisition of PT Industri Pameran Nusantara (Note 25); the restated columns are used so FY2024 is comparable with FY2025.
Share Price — Available History Since January 2026
The stock closed at Rp3,760 on Jul 23, 2026 — down 48% over the window shown, trading between Rp3,140 and Rp7,325. At that close the stock trades at 16× FY2025 diluted EPS as reported below.
Source: market price feed, daily closes, Jan 2026–Jul 2026 — the feed marks this available history as partial. Price return only, excludes dividends.
FY2025 at a Glance
Revenue (Rp billion)
Net income (Rp billion)
Diluted EPS
Source: FY2025 consolidated statements [1] [2] [3] [4]. Click any linked figure to open the filing page with the row highlighted.
Net Revenues by Type
| Net Revenues by Type | FY2021 | FY2022 | FY2023 | FY2024 | FY2025 |
|---|---|---|---|---|---|
| Sales of lands and buildings | 124.6 | 567.6 | 1,944.1 | 2,241.8 | 2,420.6 |
| Rental | 0.000 | 0.139 | 0.354 | 1.008 | 35.467 |
| Others | 0.521 | 6.333 | 9.056 | 6.177 | 47.589 |
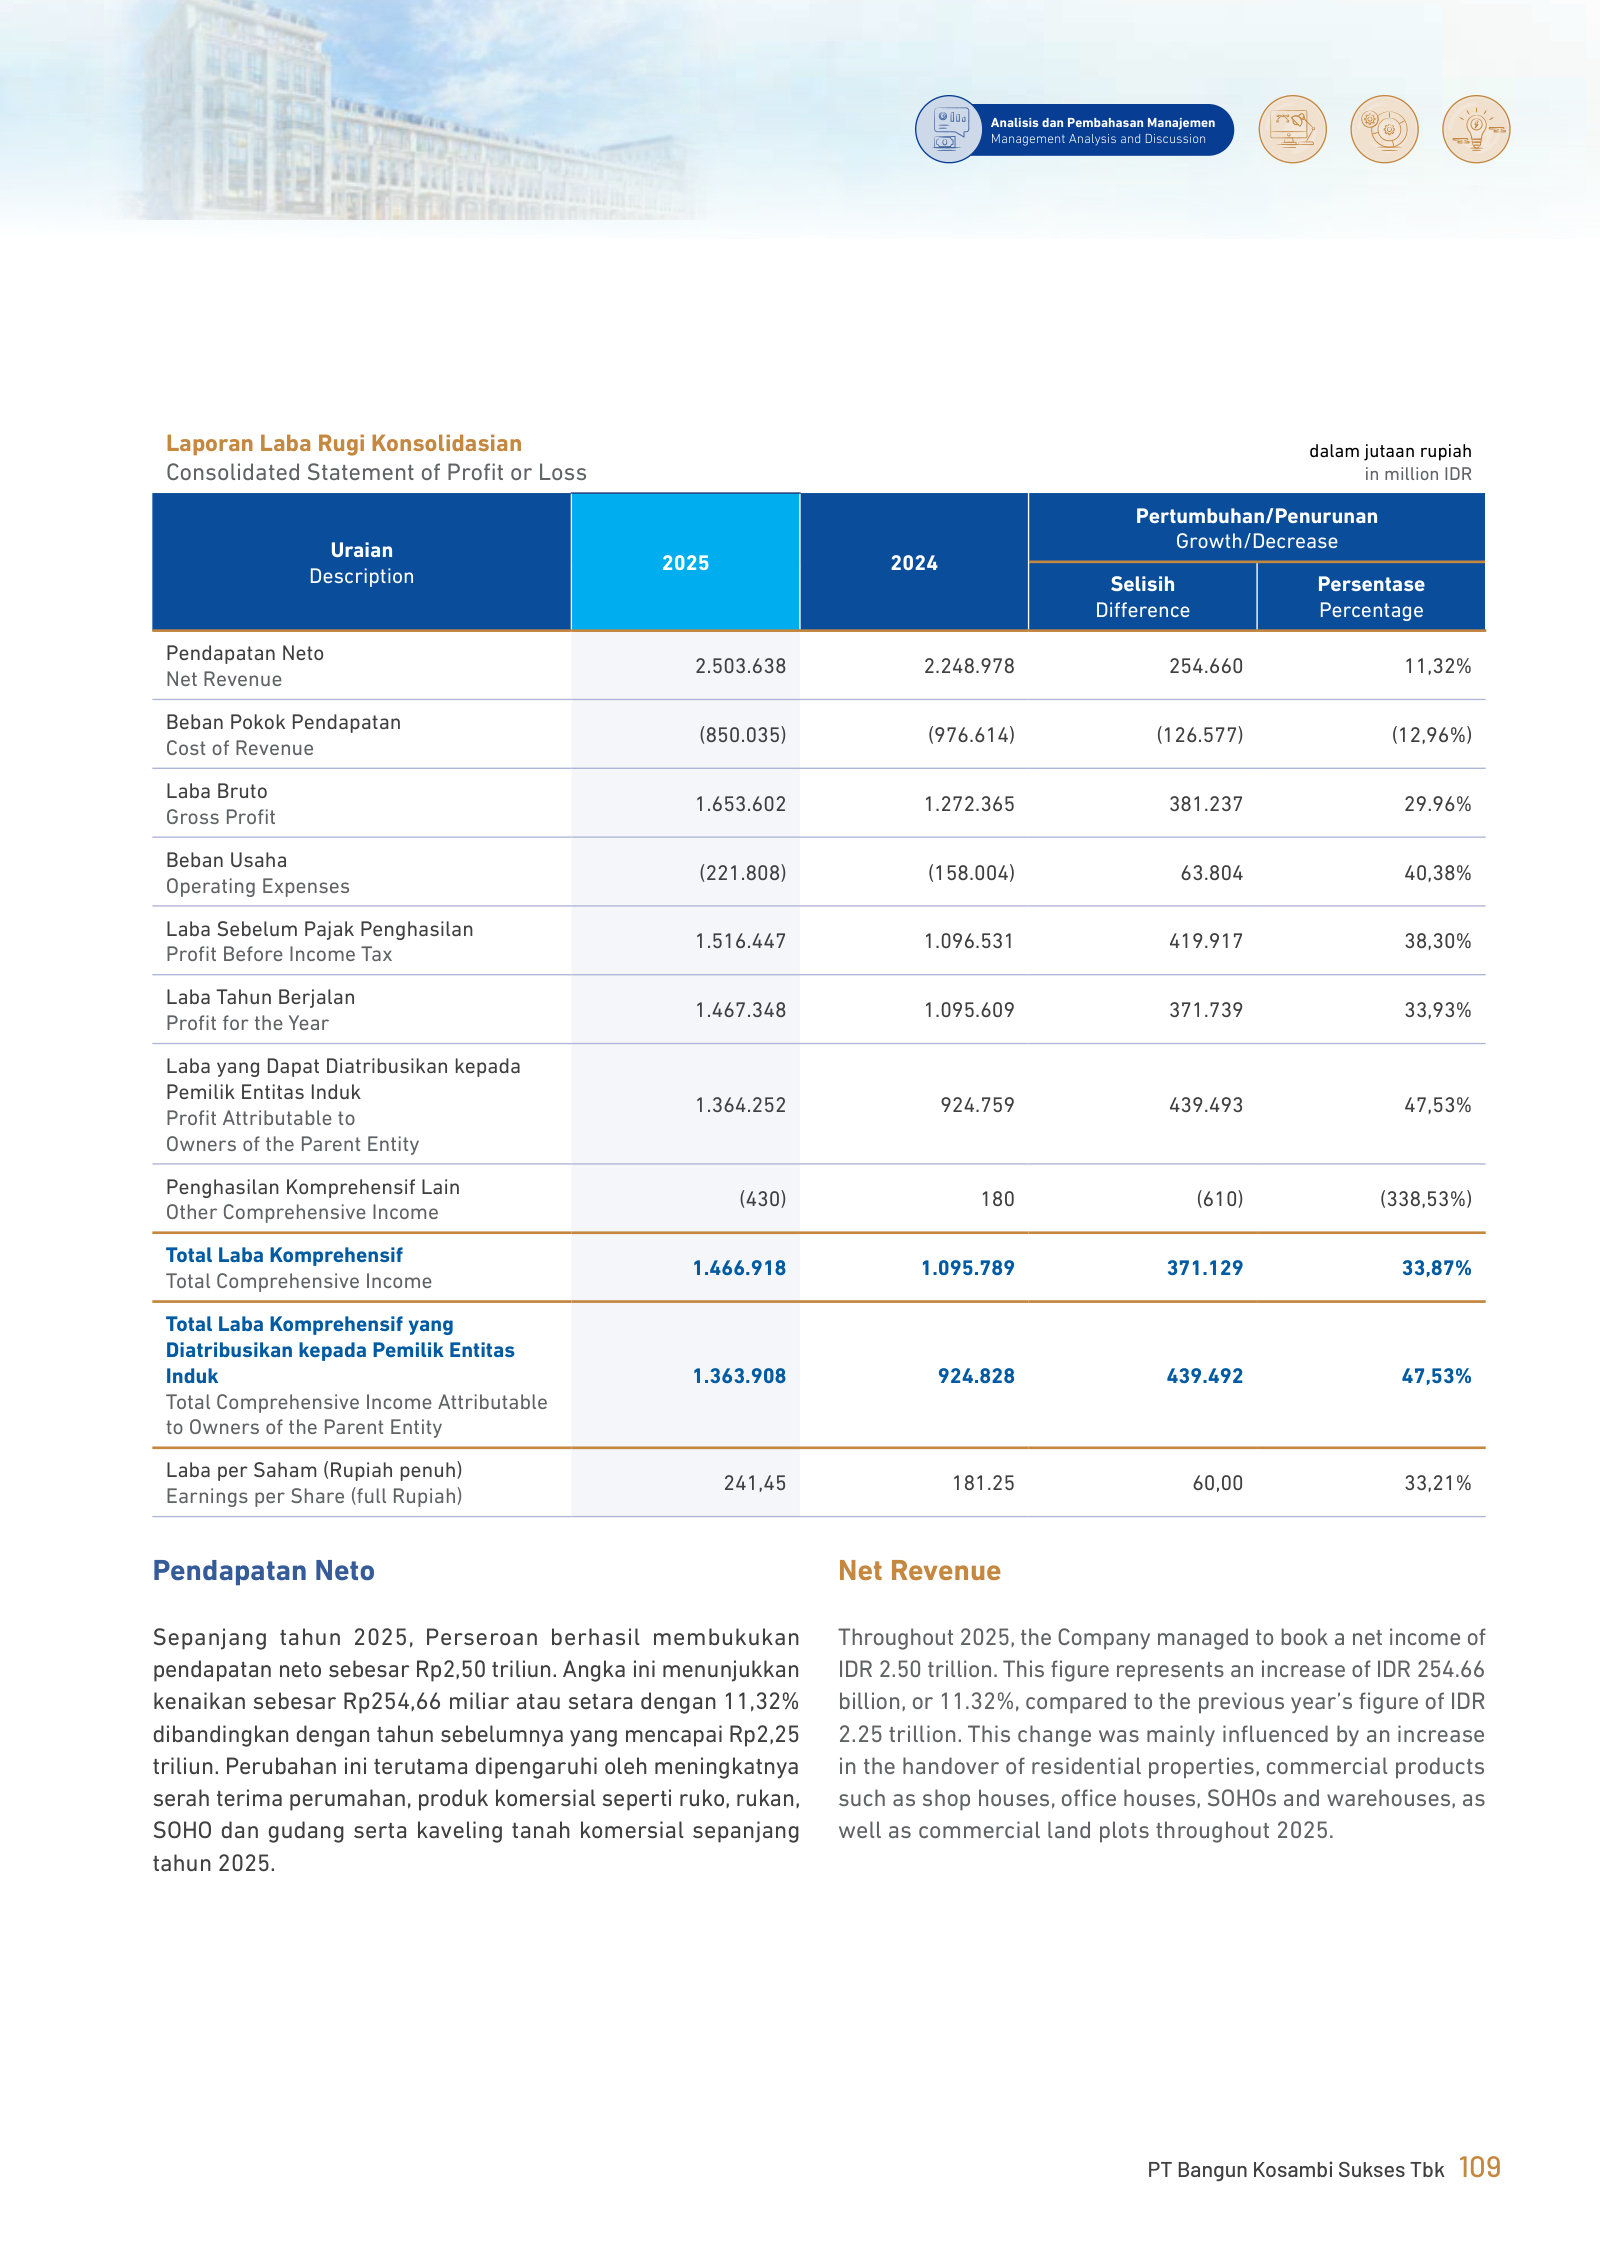
| Net revenues | 125.2 | 574.1 | 1,953.5 | 2,249.0 | 2,503.6 |
| Net revenues growth, derived | — | +358.7% | +240.3% | +15.1% | +11.3% |
Source: Net revenues note to the audited consolidated financial statements (Note 17 in FY2025, Note 23 in FY2024, Note 15 in FY2023 and FY2022); totals from the consolidated statements of profit or loss [5] [2] [6] [4]. Click any linked figure to open the filing page with the row highlighted.
Business Segments
| Business Segments | FY2021 | FY2022 | FY2023 | FY2024 | FY2025 |
|---|---|---|---|---|---|
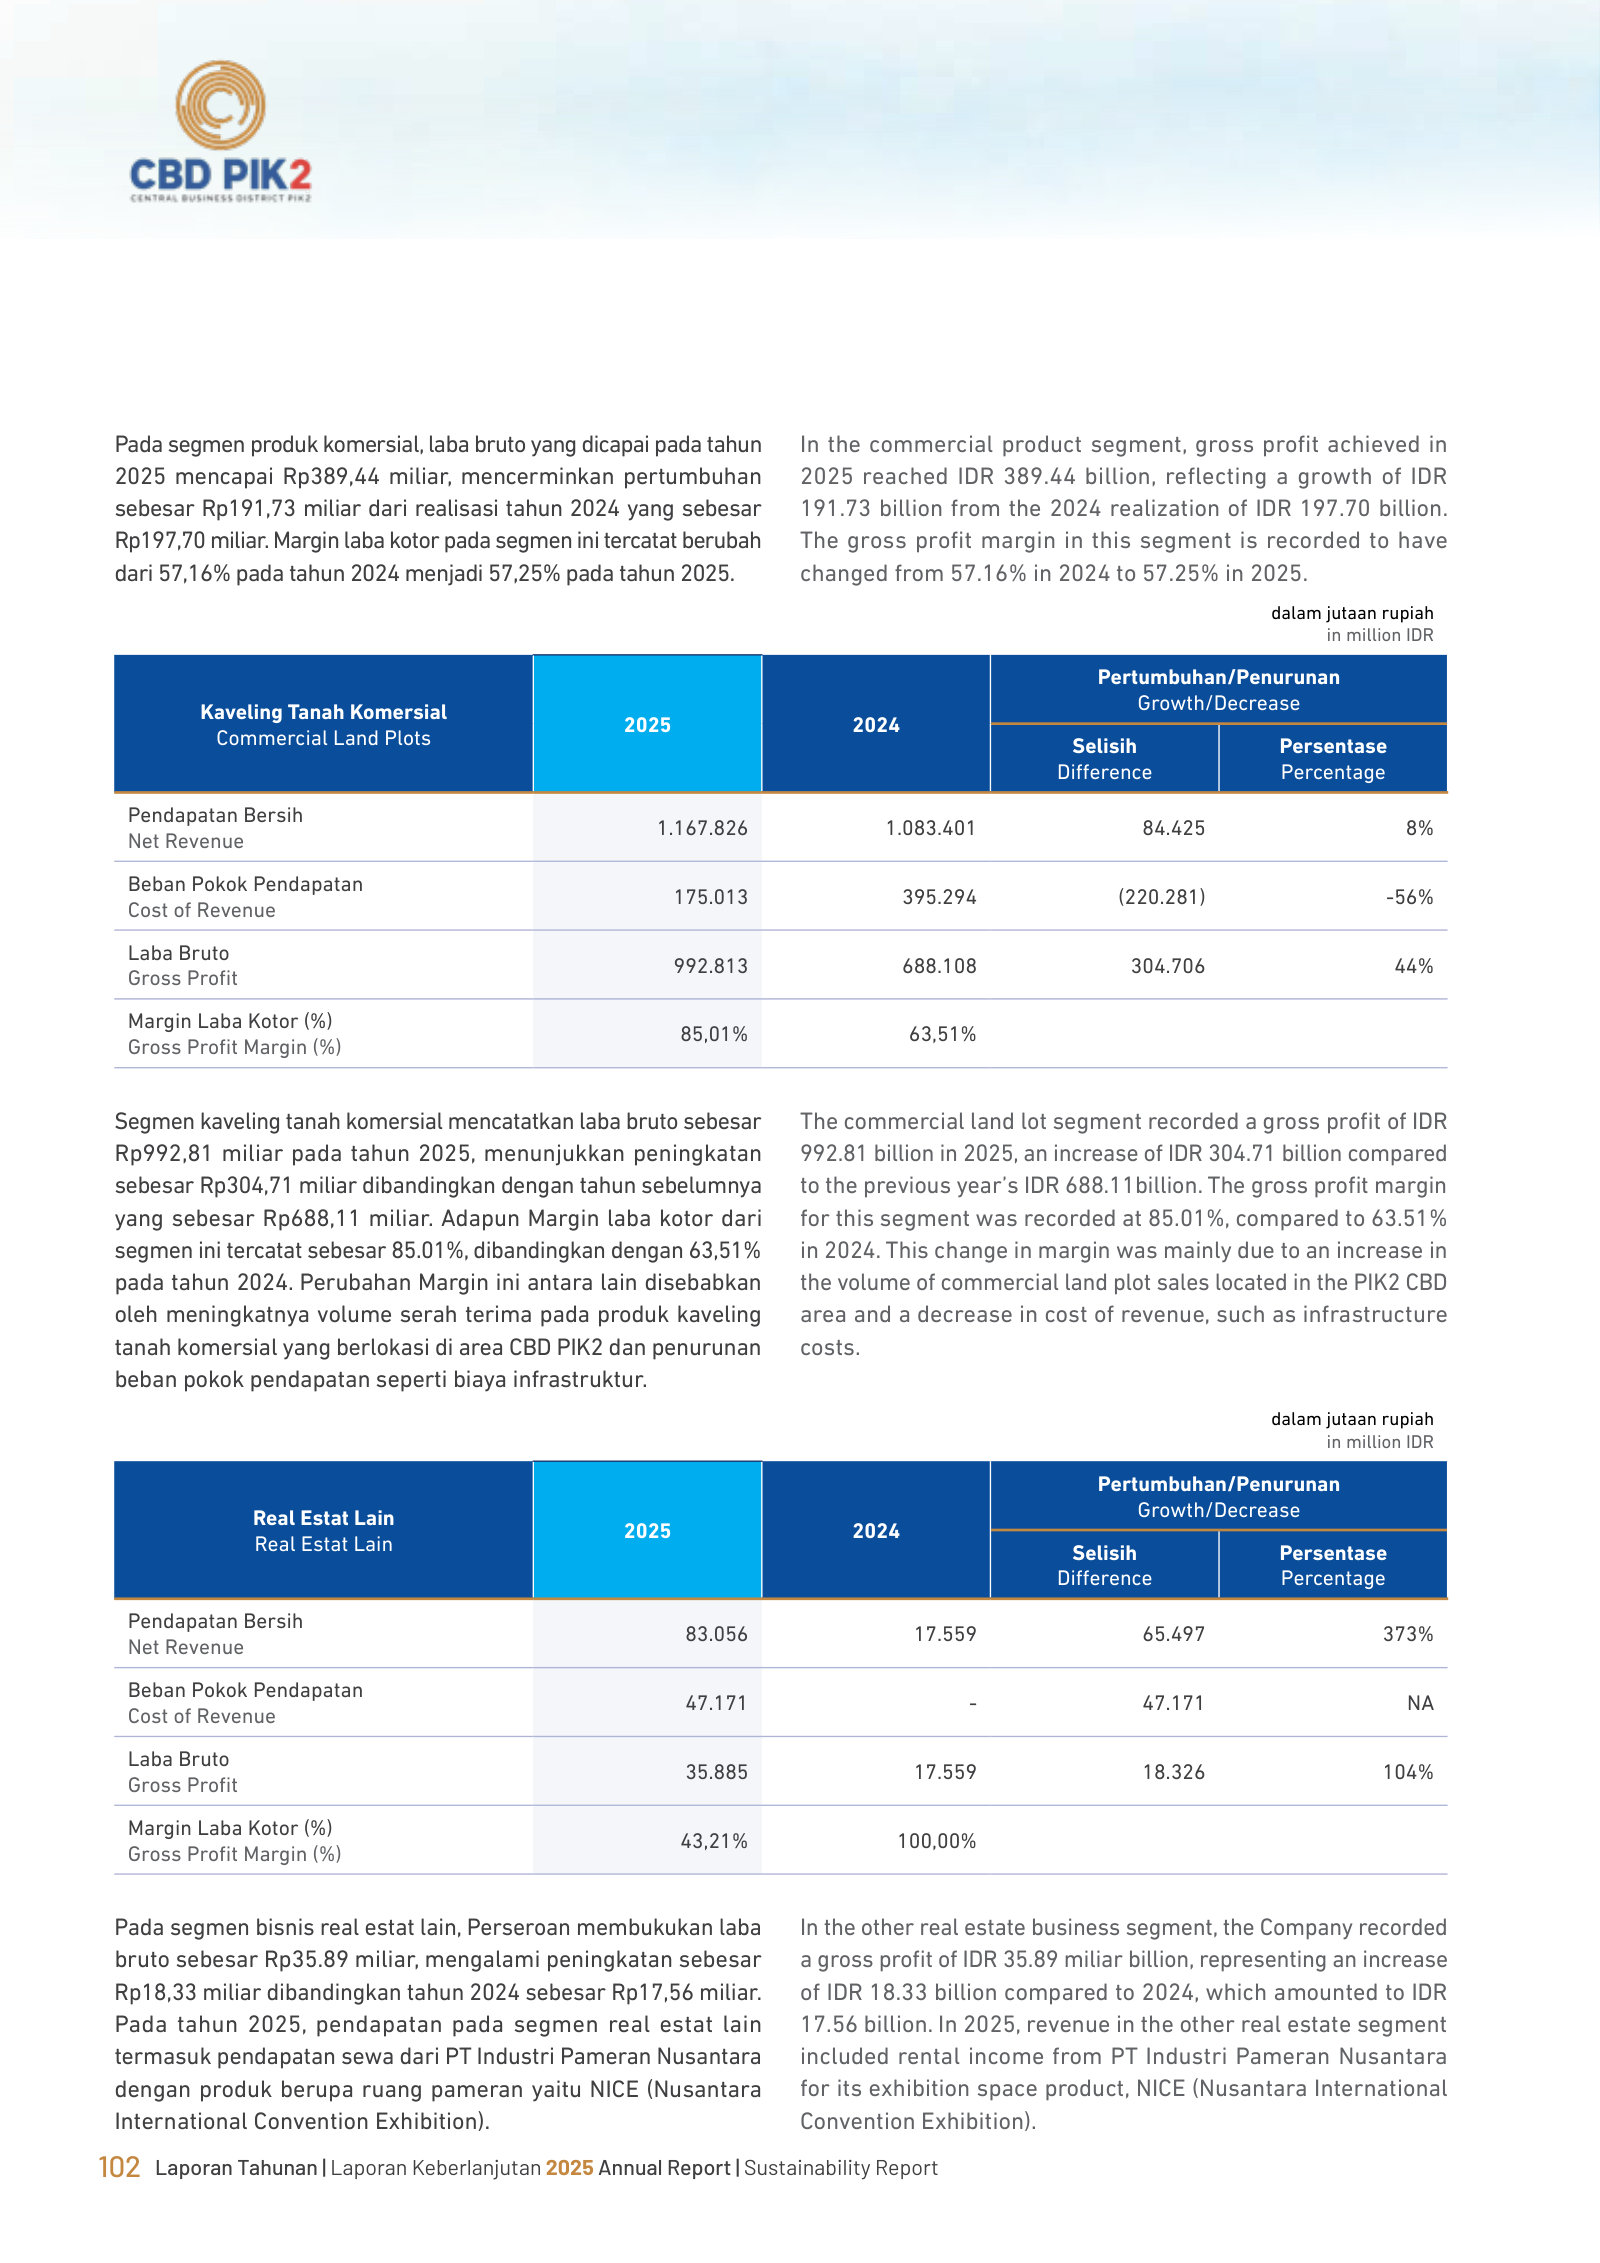
| Real estate - net revenues | — | — | — | 2,249.0 | 2,464.2 |
| Convention and exhibition - net revenues | — | — | — | 0.000 | 39.393 |
| Net revenues - consolidated | — | — | — | 2,249.0 | 2,503.6 |
| Real estate - gross profit | — | — | — | 1,224.5 | 1,660.6 |
| Convention and exhibition - gross profit | — | — | — | 0.000 | (6.963) |
| Gross profit - consolidated | — | — | — | 1,272.4 | 1,653.6 |
Source: Note 22 Operating Segment, FY2025 audited consolidated financial statements; the Group reported a single real estate segment before FY2025 [7] [2]. Click any linked figure to open the filing page with the row highlighted.
Income Statement
Source: Consolidated Statements of Profit or Loss and Other Comprehensive Income [1] [2] [3] [4]. Click any linked figure to open the filing page with the row highlighted.
Columns marked E are consensus analyst estimates from analyst consensus, shown alongside reported results for direct comparison; they are not company guidance.
Estimate source: analyst consensus (claude_web), as of 2026-07-25. Forecasts carry no filing page links.
Balance Sheet
Source: Consolidated Statements of Financial Position [8] [9] [10] [11]. Click any linked figure to open the filing page with the row highlighted.
Cash Flow
Source: Consolidated Statements of Cash Flows [12] [13] [14] [15]. Click any linked figure to open the filing page with the row highlighted.
Marketing Sales vs Target
| Marketing Sales vs Target | FY2021 | FY2022 | FY2023 | FY2024 | FY2025 |
|---|---|---|---|---|---|
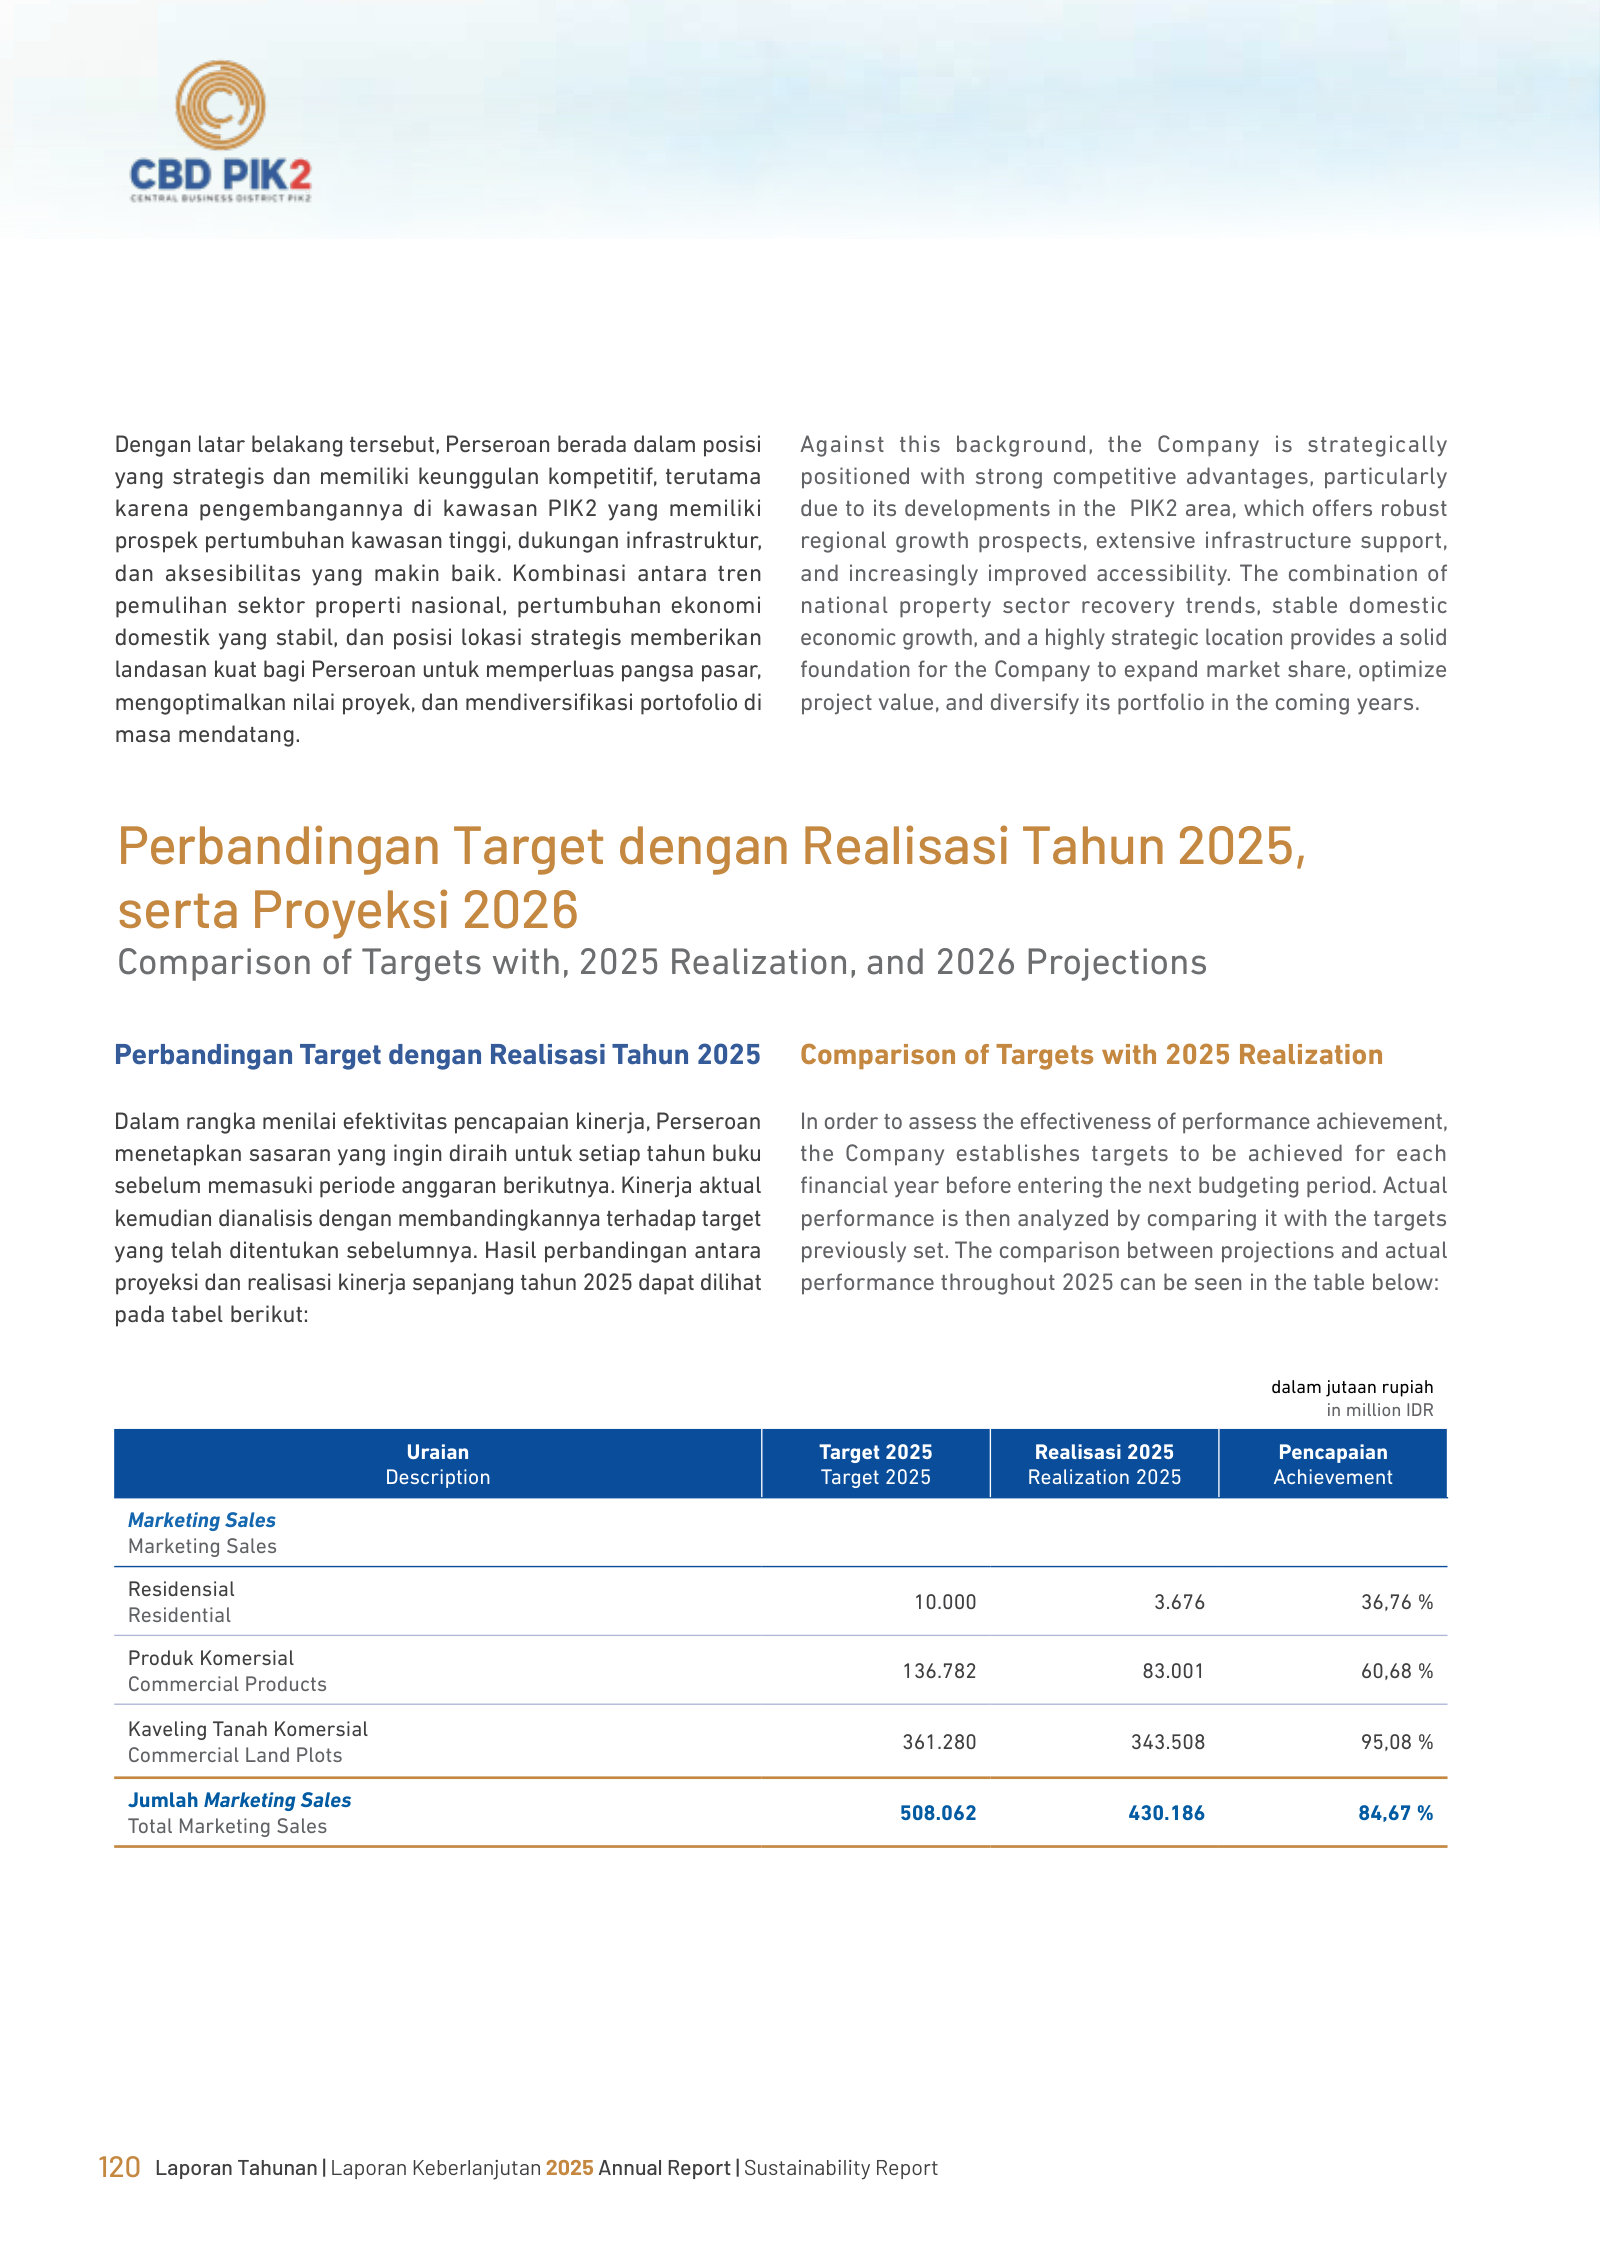
| Total marketing sales | — | — | — | 2,115.0 | 430.2 |
| Marketing sales target for the year | — | — | — | 2,565.0 | 508.1 |
| Marketing sales achieved vs target | — | — | — | 82.46% | 84.67% |
| Achieved vs target - Residential | — | — | — | 87.34% | 36.76% |
| Achieved vs target - Commercial products | — | — | — | 62.04% | 60.68% |
| Achieved vs target - Commercial land lots | — | — | — | 87.33% | 95.08% |
Source: company filings [16] [17]. Click any linked figure to open the filing page with the row highlighted.
Real Estate Product Lines
| Real Estate Product Lines | FY2021 | FY2022 | FY2023 | FY2024 | FY2025 |
|---|---|---|---|---|---|
| Residential - net revenue | — | — | — | 802.1 | 572.5 |
| Commercial products - net revenue | — | — | — | 345.9 | 680.2 |
| Commercial land plots - net revenue | — | — | — | 1,083.4 | 1,167.8 |
| Other real estate - net revenue | — | — | — | 17.6 | 83.1 |
| Residential - gross profit margin | — | — | — | 46.00% | 41.14% |
| Commercial products - gross profit margin | — | — | — | 57.16% | 57.25% |
| Commercial land plots - gross profit margin | — | — | — | 63.51% | 85.01% |
| Other real estate - gross profit margin | — | — | — | 100.00% | 43.21% |
Source: company filings [18] [19]. Click any linked figure to open the filing page with the row highlighted.
Solvency and Returns as Reported
| Solvency and Returns as Reported | FY2021 | FY2022 | FY2023 | FY2024 | FY2025 |
|---|---|---|---|---|---|
| Current ratio | — | — | 1.49 | 1.25 | 1.20 |
| Quick ratio | — | — | — | 0.50 | 0.45 |
| Interest coverage | — | — | — | 34.93 | 50.37 |
| Return on assets | — | — | 3.36% | 4.56% | 6.50% |
| Return on equity | — | — | 7.52% | 11.11% | 12.25% |
| Net debt/(net cash) | — | — | — | (3,118.3) | (2,871.6) |
Source: company filings [20] [21] [22]. Click any linked figure to open the filing page with the row highlighted.
Land Bank, MICE and Workforce
| Land Bank, MICE and Workforce | FY2021 | FY2022 | FY2023 | FY2024 | FY2025 |
|---|---|---|---|---|---|
| Land under development and buildings ready for sale (sqm) | — | — | 3,399,434 | 3,656,578 | 3,678,961 |
| Undeveloped land (sqm) | — | — | 3,976,474 | 3,325,966 | 3,341,874 |
| Events held at NICE convention centre | — | — | — | — | 14 |
| Employees | — | — | 365 | 308 | 449 |
| Capital goods investment realized | — | — | — | — | 2,300.0 |
Source: company filings [23] [24] [25] [26]. Click any linked figure to open the filing page with the row highlighted.
Long-Term Record
| Fiscal year | Net revenues | Gross profit | Profit for the year | Earnings per share - basic and diluted (full Rupiah) | Net cash flows generated from operating activities | Total equity |
|---|---|---|---|---|---|---|
| FY2021 | 125.2 | 61.8 | 75.4 | — | (82.0) | 432.2 |
| FY2022 | 574.1 | 397.5 | 296.0 | — | 602.0 | 7,282.6 |
| FY2023 | 1,953.5 | 986.9 | 804.5 | 113.40 | 966.8 | 7,688.7 |
| FY2024 | 2,249.0 | 1,272.4 | 1,095.6 | 181.25 | 1,730.3 | 8,322.8 |
| FY2025 | 2,503.6 | 1,653.6 | 1,467.3 | 241.45 | 719.4 | 11,982.4 |
Source: consolidated statements across filings; older years from the standardized feed [13] [1] [2] [8]. Click any linked figure to open the filing page with the row highlighted.
Operating KPIs
| KPI | FY2021 | FY2022 | FY2023 | FY2024 | FY2025 |
|---|---|---|---|---|---|
| Marketing sales - Residential | — | — | 402.8 | 317.9 | 3.7 |
| Marketing sales - Commercial products | — | — | 1,001.8 | 307.7 | 83.0 |
| Marketing sales - Commercial land lots | — | — | 835.3 | 1,488.9 | 343.5 |
| Total land reserves (hectares) | — | — | 737 | 698 | 702 |
| Total products/projects | — | — | 14 | 13 | 16 |
Source: company-reported operating metrics [27]. Click any linked figure to open the filing page with the row highlighted.
Analyst Consensus
Mean target
Street ratings: Strong Buy on minimal coverage: 1 Buy / 0 Hold / 0 Sell from 1 analyst (Investing.com, trailing 3 months). Mean = high = low = IDR 13,700, implying +278% upside vs the IDR 3,620 close on 2026-07-24 — the target is evidently stale relative to the stock's decline (52-week range 3,010-9,775). Simply Wall St explicitly states there is insufficient analyst coverage to forecast growth for CBDK; StockAnalysis shows no price target or consensus; TradingView returns null for all price-target and recommendation fields; MarketBeat, TipRanks and Zacks do not cover this Indonesian listing. Separate local broker calls not reflected in the aggregator consensus: Bahana Sekuritas Buy, TP IDR 13,100; Sucor Sekuritas Buy, TP IDR 11,000-12,000; Kiwoom Sekuritas trading buy, near-term TP IDR 3,500.
Estimate source: analyst consensus (claude_web), as of 2026-07-25. Forecasts carry no filing page links.
Traceability
382 of 389 figures on this page (98%) link to the filing page where they are printed — click a linked figure to open the source PDF at that page with the row highlighted. Unlinked figures come from standardized data feeds or pre-filing years.
All figures are in Rp billion, converted from the thousands of Rupiah printed in the filings; per-share amounts are in full Rupiah exactly as printed.
Citation filings: FY2025 and FY2024 from the audited statements for the years ended 31 December 2025 and 2024; FY2023 income statement and cash flow from the audited statements for 2024 and 2023; FY2022 and FY2021 income statement and cash flow from the audited statements for 2022 and 2021.
Balance sheet basis: FY2023, FY2024 and FY2025 are the three columns (1 January 2024, 31 December 2024 restated, 31 December 2025) printed in the FY2025 audited statements; FY2022 and FY2021 are the restated 31 December 2022 and 1 January 2022 columns printed in the FY2023 audited statements, which split customer advances between current and non-current on the same basis as later years.
FY2024 comparatives were restated under the pooling-of-interests method for the January 2025 acquisition of PT Industri Pameran Nusantara (Note 25); the restated columns are used so FY2024 is comparable with FY2025.
The Group reported a single real estate segment through FY2024; convention and exhibition became a reported segment in FY2025 with the NICE venue, so the segment table carries FY2024 and FY2025 only.
Earnings per share is not shown for FY2021 and FY2022: those statements were issued on a pre-IPO base of 204,082 shares and are not comparable with the 5,102,050,000 and 5,668,944,500 share bases of later years. FY2023 EPS of 113.40 is the comparative printed in the FY2024 statements on the 5,102,050,000 share basis.
No comparable history exists before FY2021: the standalone FY2021 audited report covers a much smaller consolidation perimeter than the restated FY2021 columns used here, so FY2020 is omitted rather than shown on an incompatible basis.
Figures shown without a link are printed as a dash (nil) in the source statement, or are lines the filing did not present in that year.
Quarterly cells for Q2-Q4 FY25 are derived by differencing the printed cumulative six-month, nine-month and full-year columns; each such citation carries the printed year-to-date anchor it was derived from. Q1 FY25 and Q1 FY26 are printed three-month columns.
Q1 FY25 investing and financing cash flow are cited to the Q1 FY2025 filing as printed; the Q1 FY2026 filing restates the same period with a Rp 99,000 thousand reclassification of the acquisition of a subsidiary between those two subtotals.
data/financials/income.json is absent for this run (no provider returned an income statement), so every income-statement figure is taken from the filings. Balance sheet and cash flow figures agree with data/financials/*.json.
7 figure(s) differed between the data feed and the filing; the filing value is shown (see the run's metrics/metrics_tab.json for the audit trail).
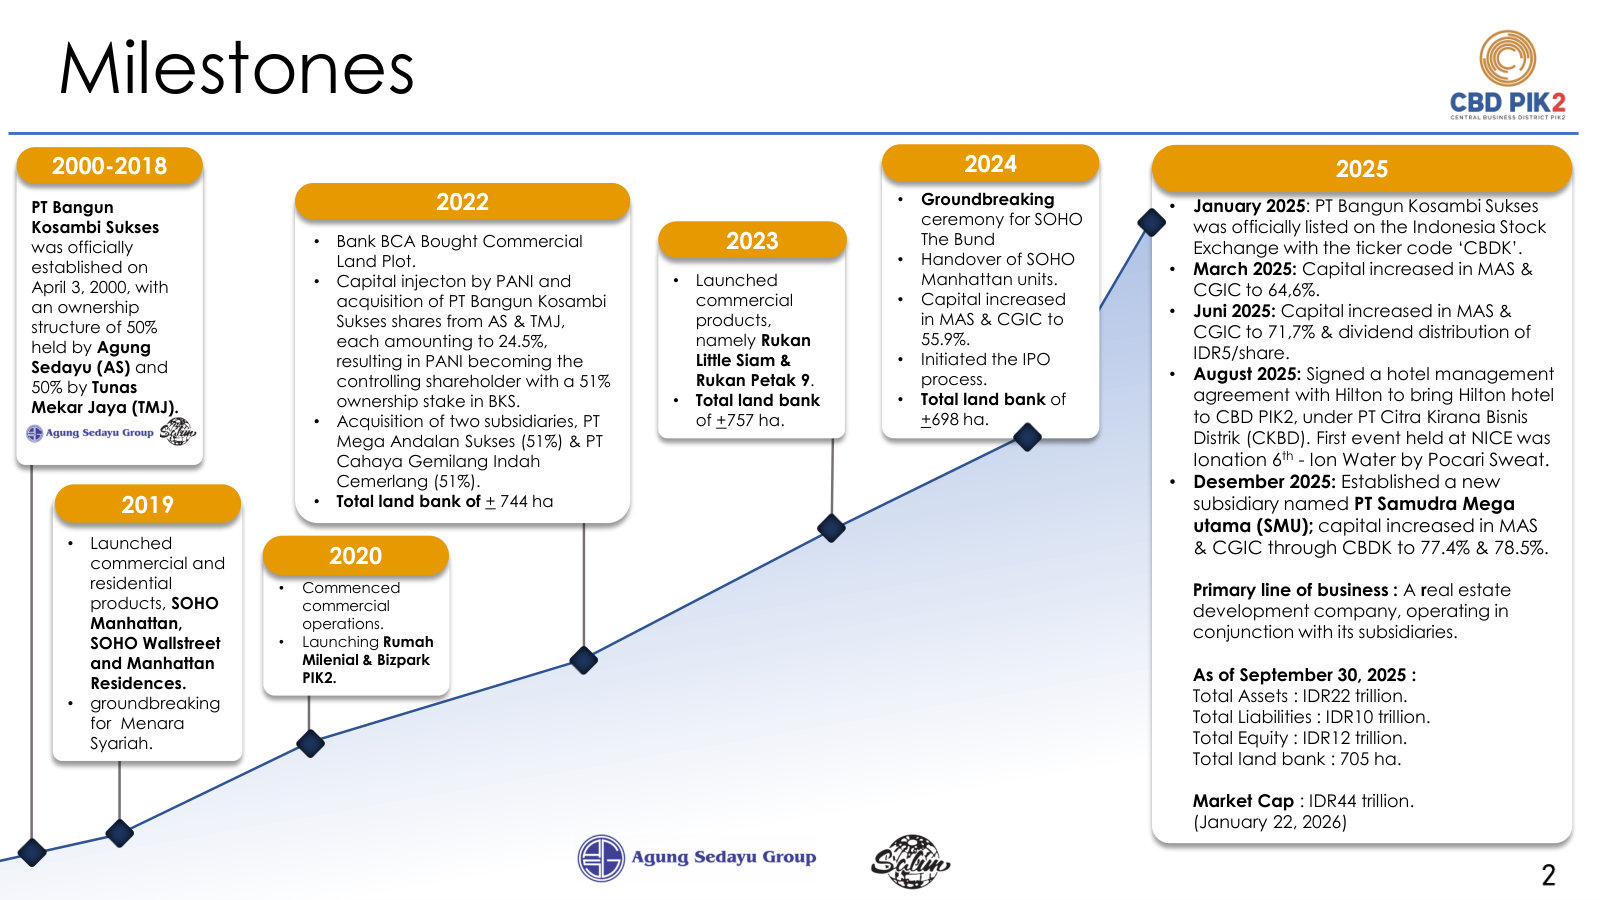
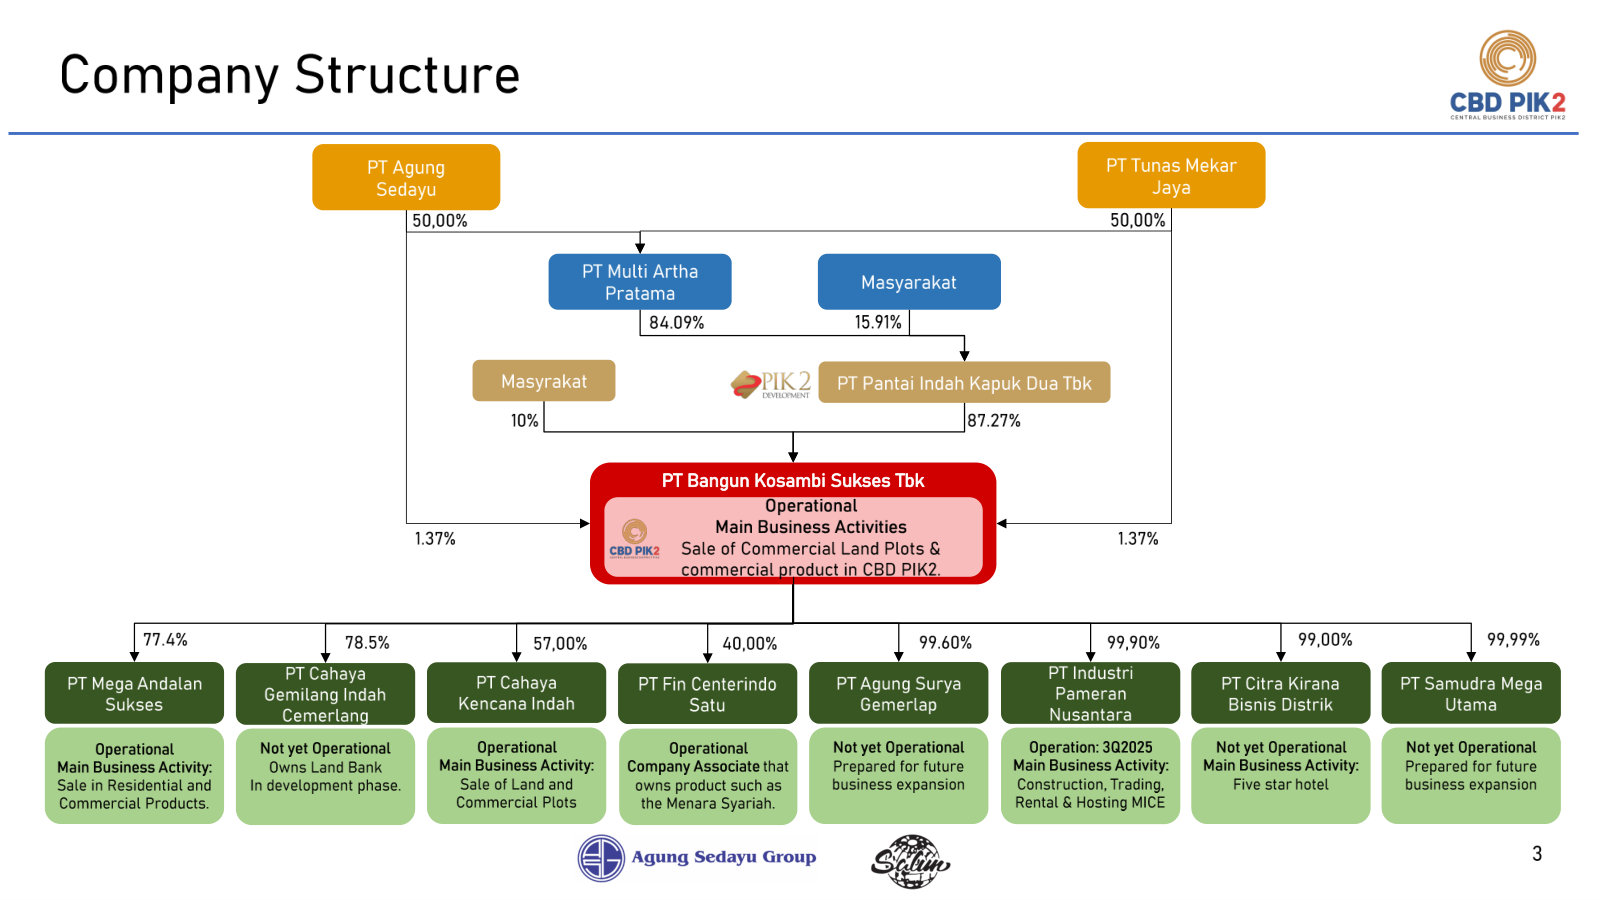
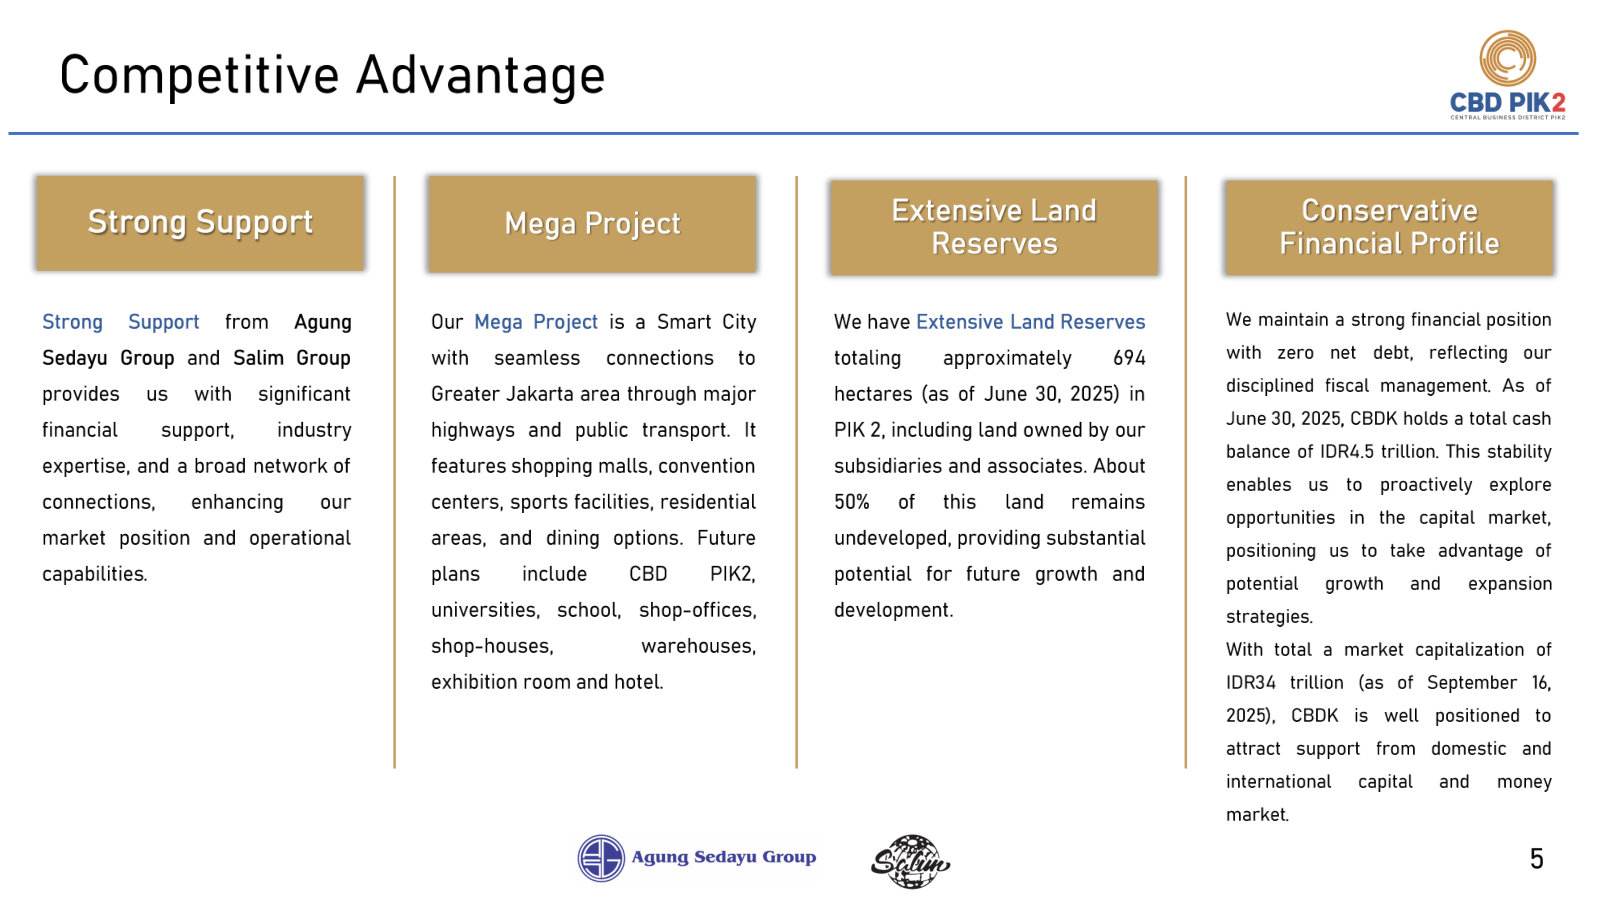
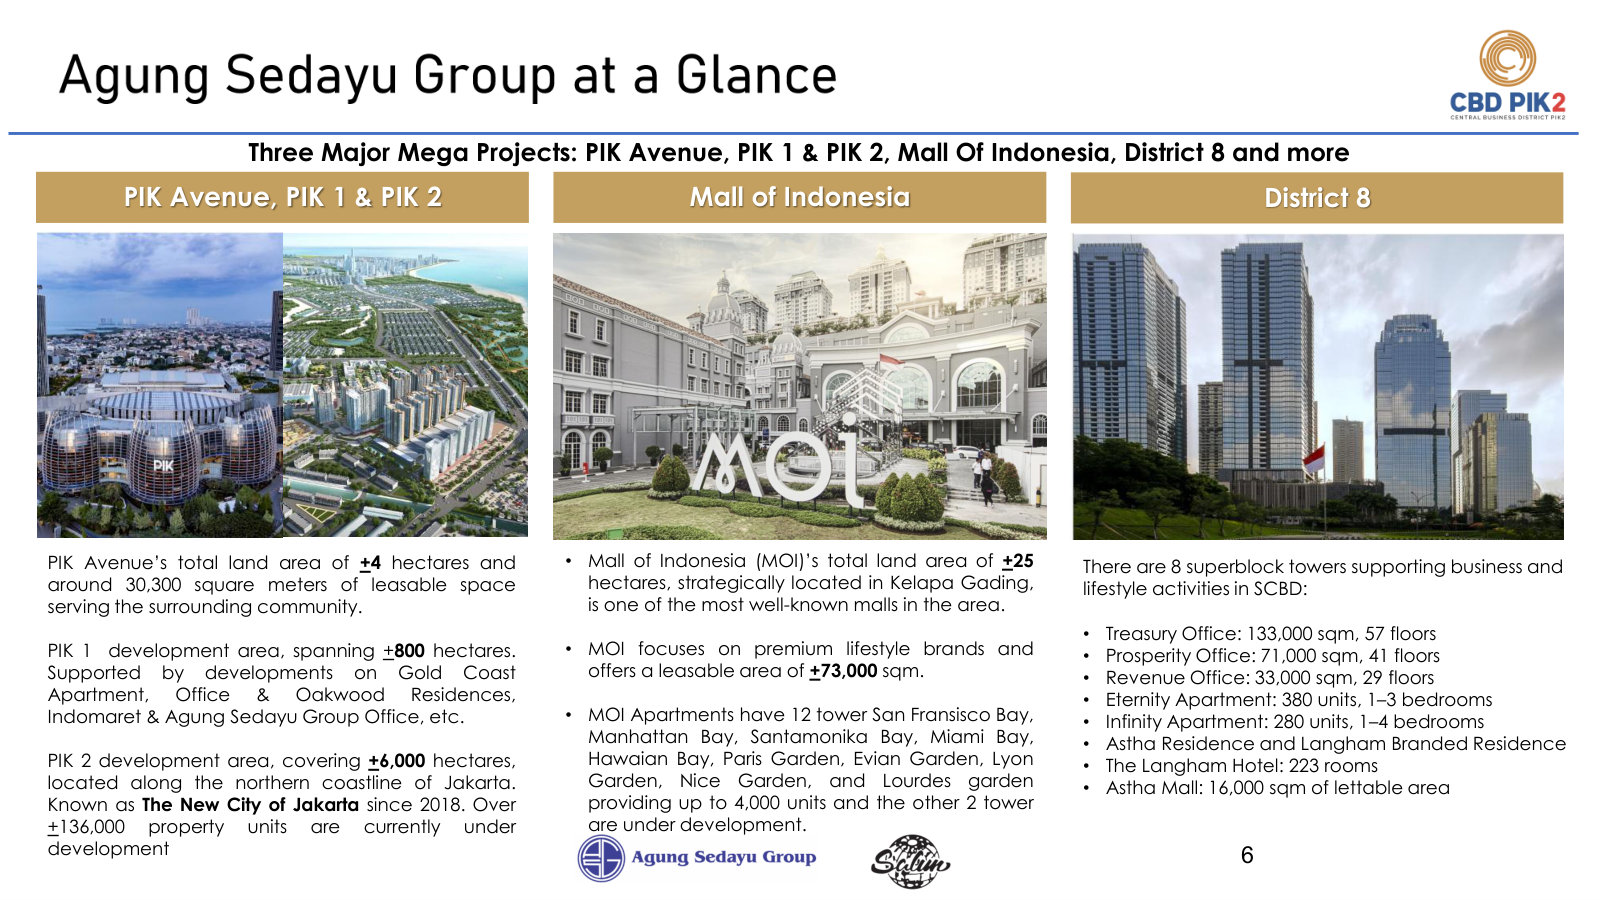
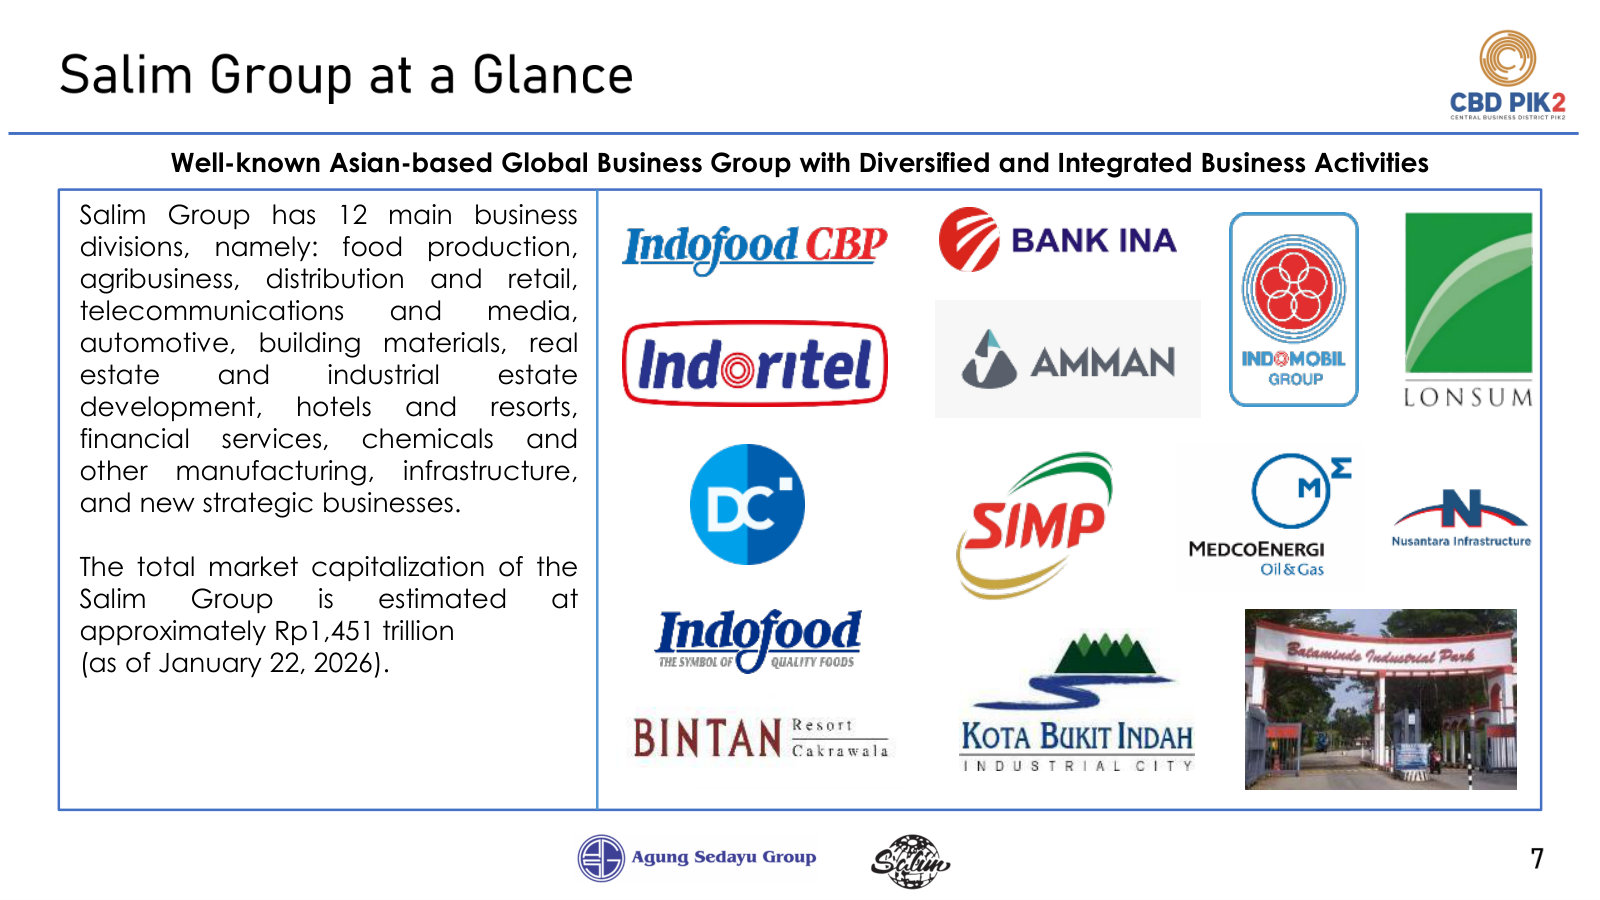
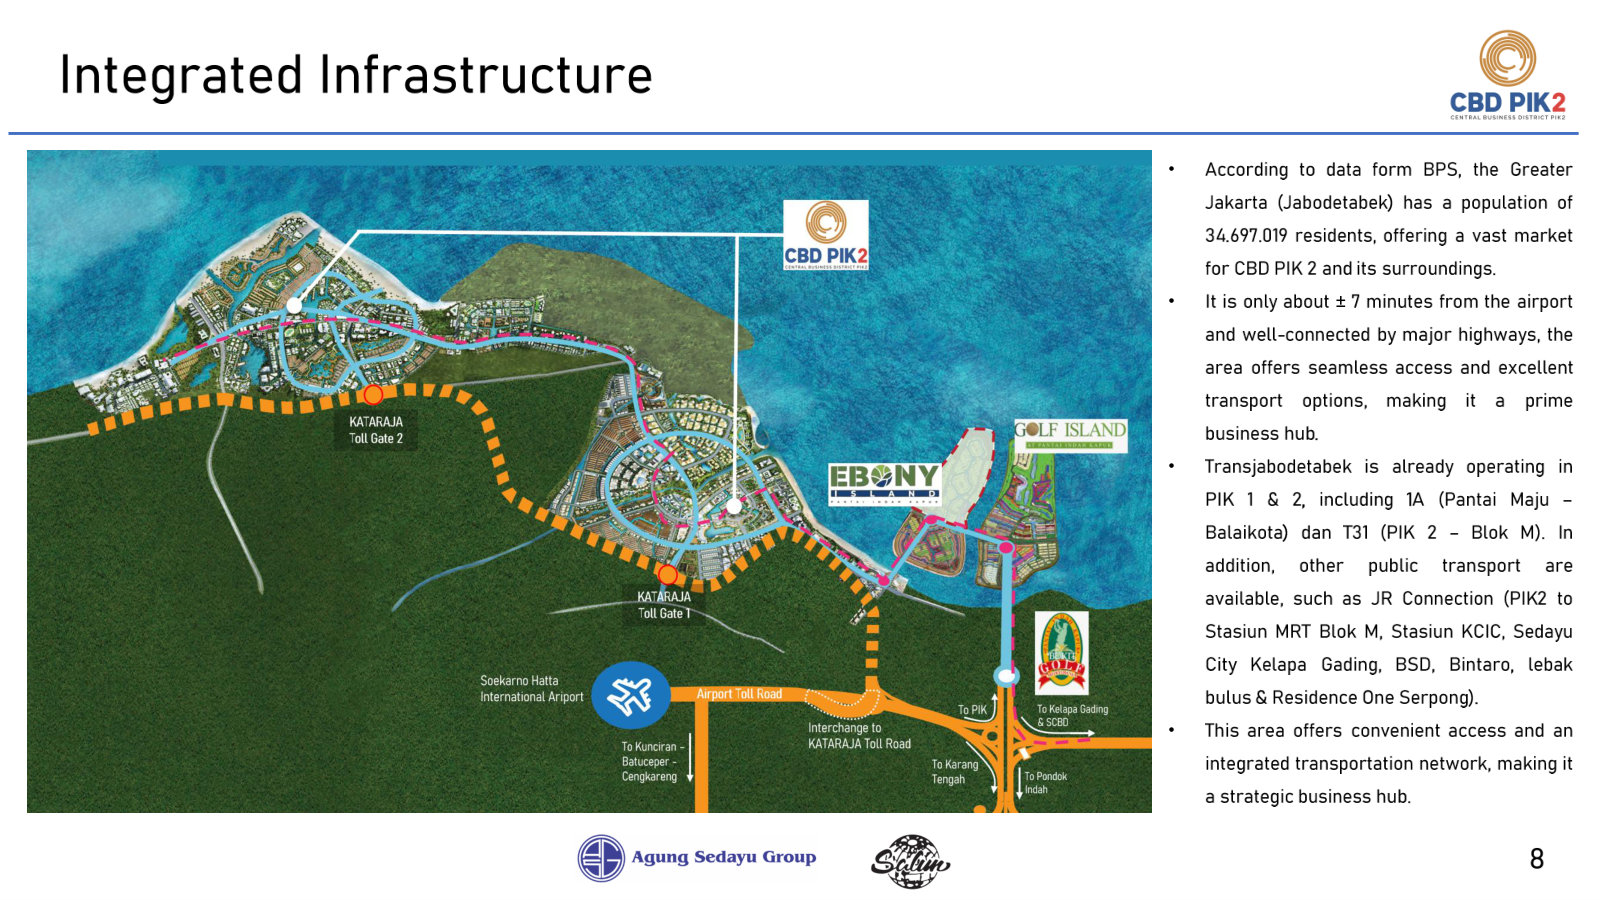
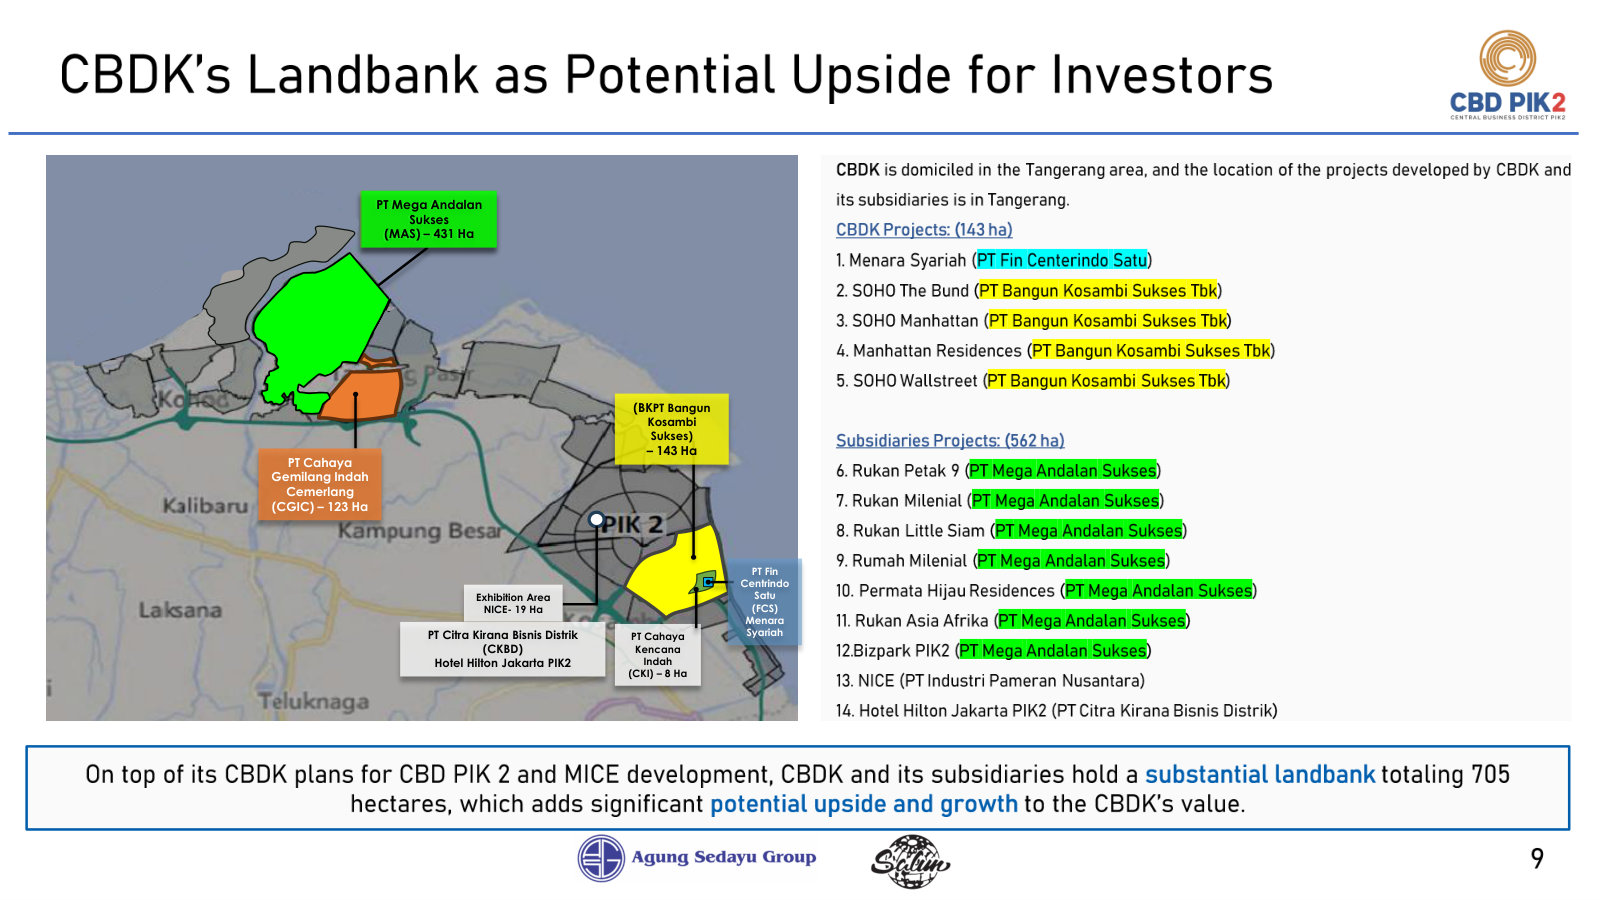
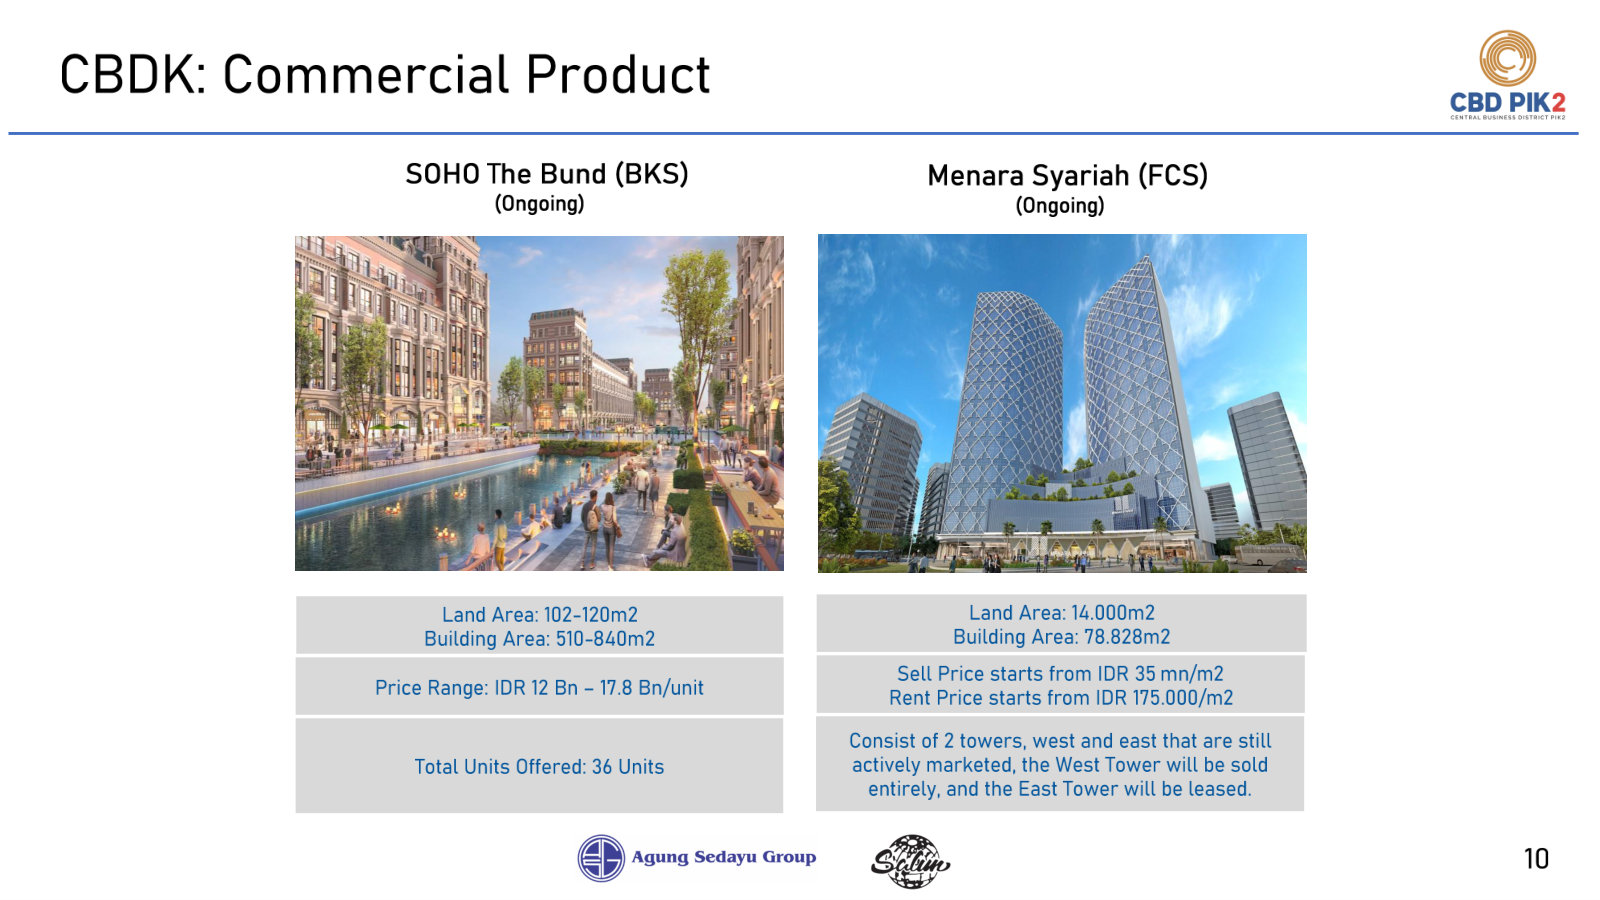
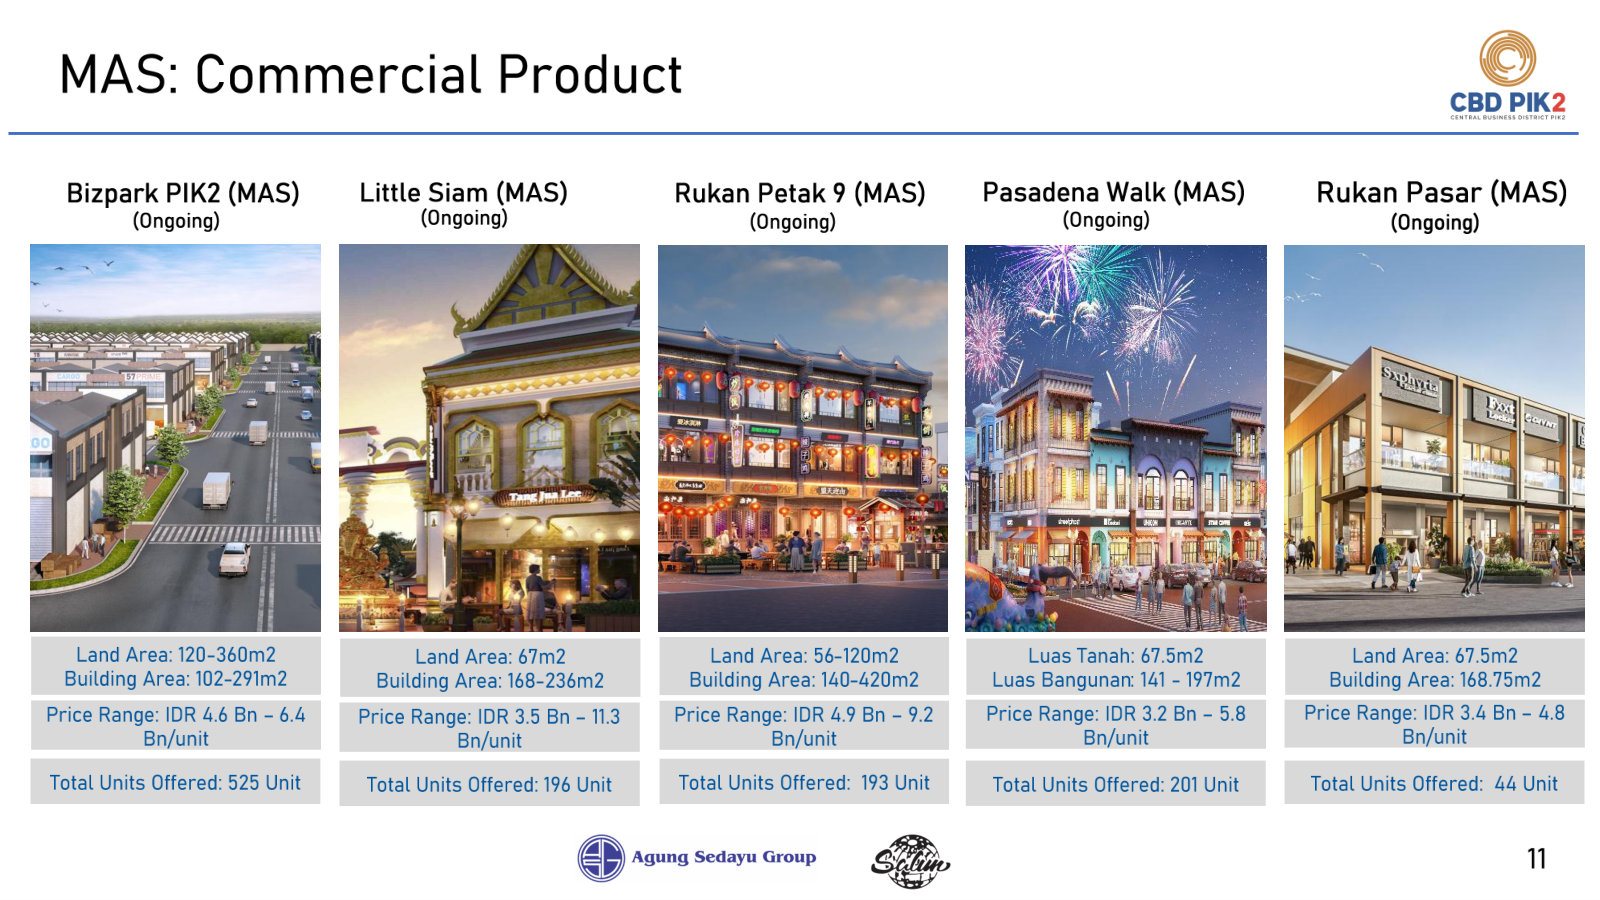
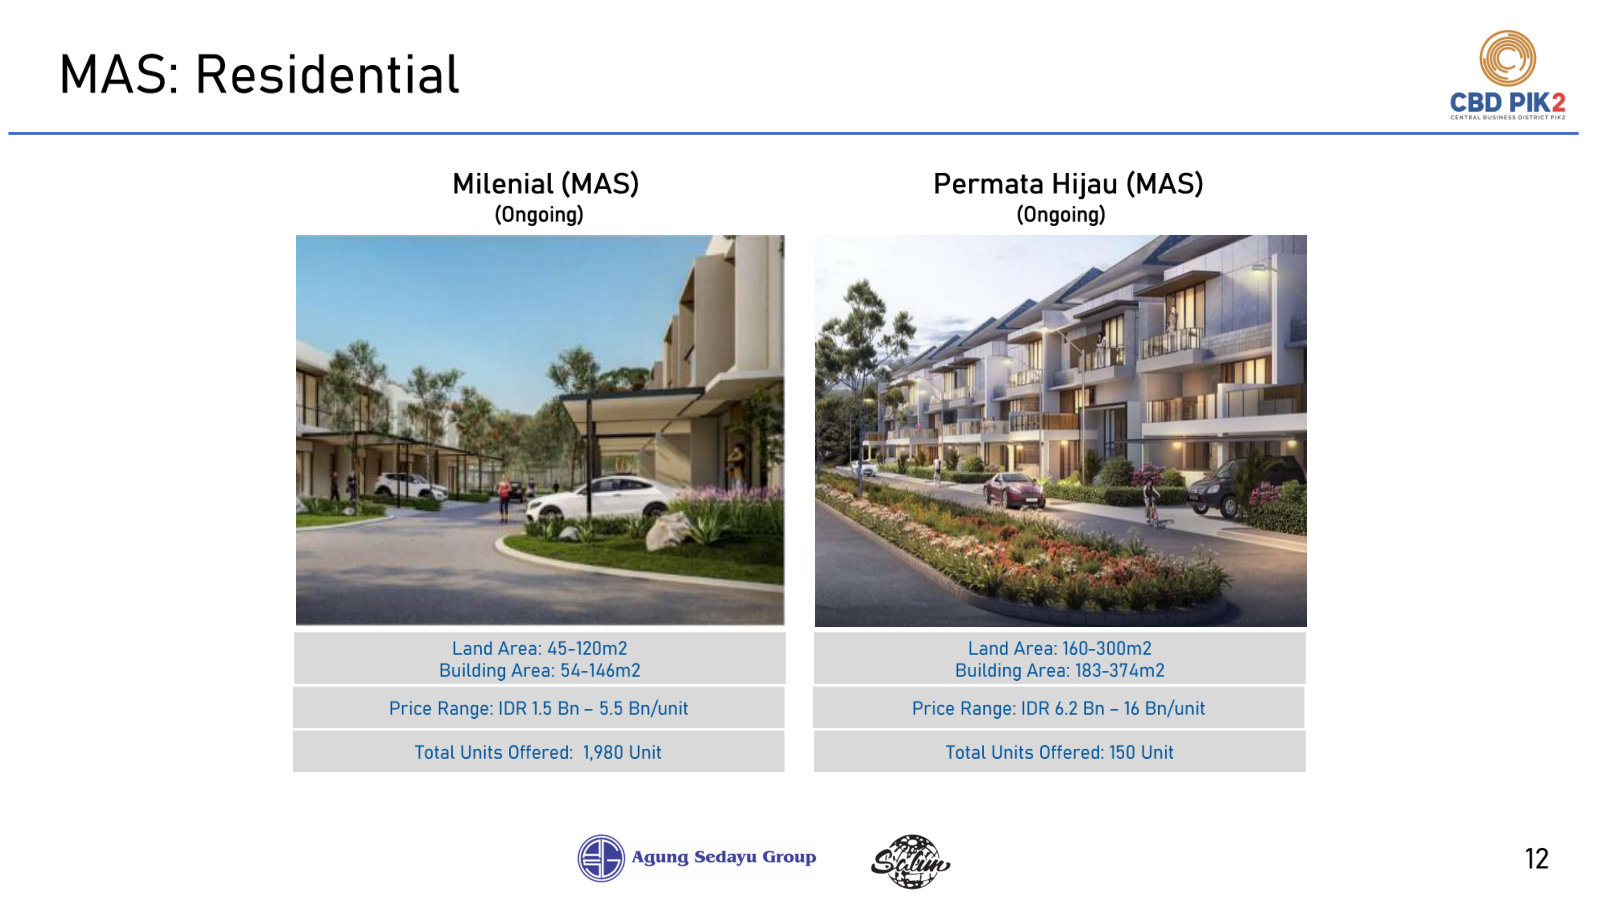
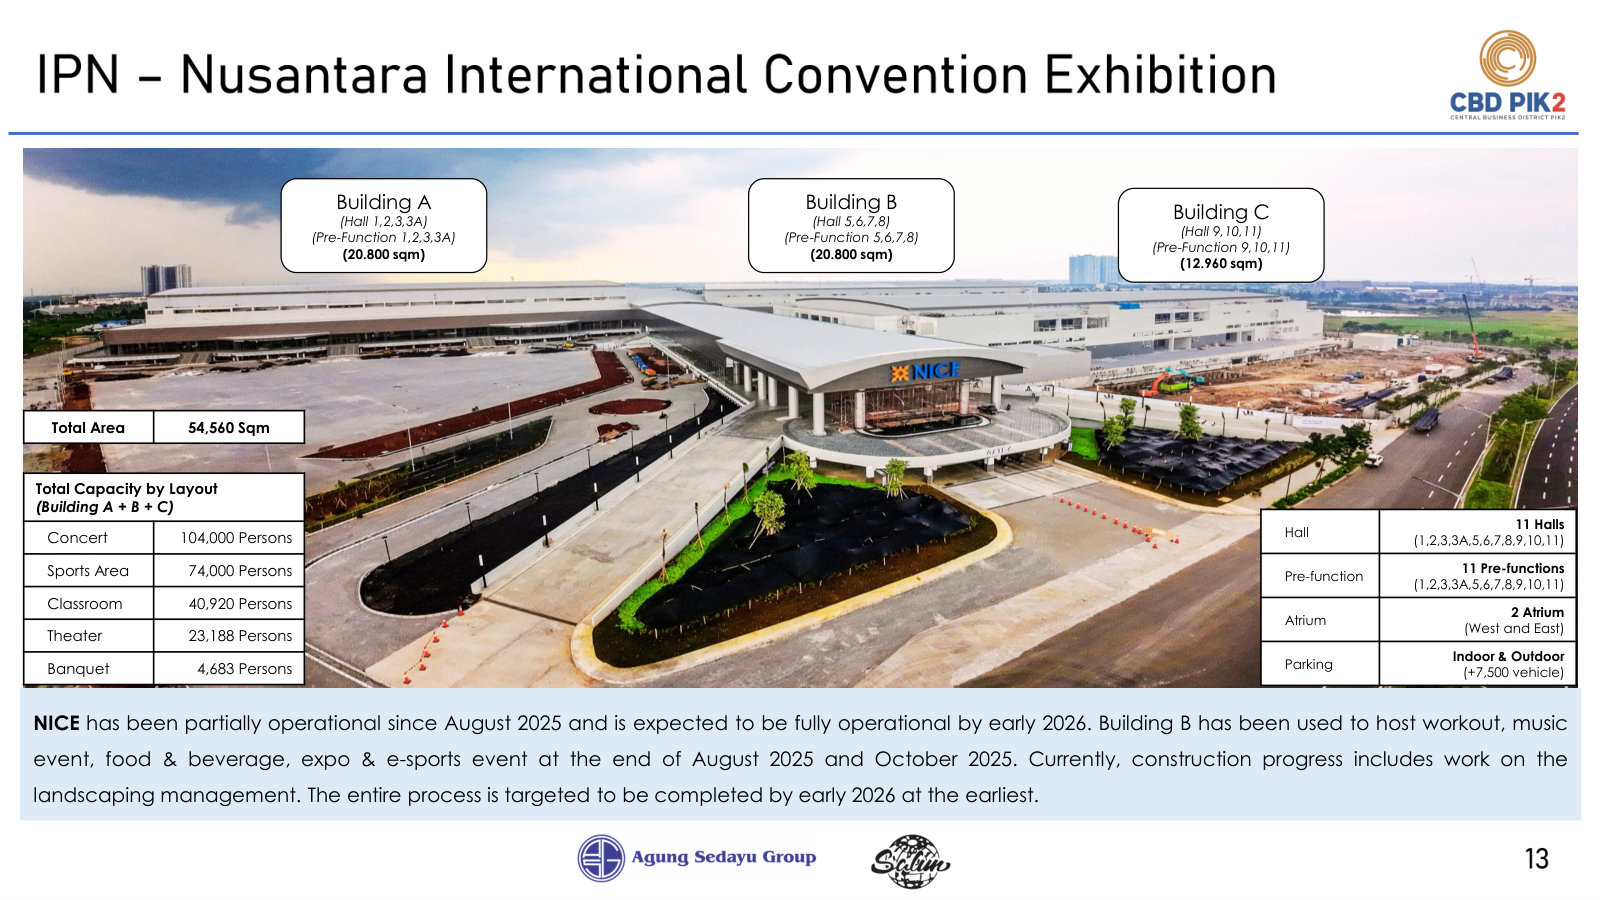
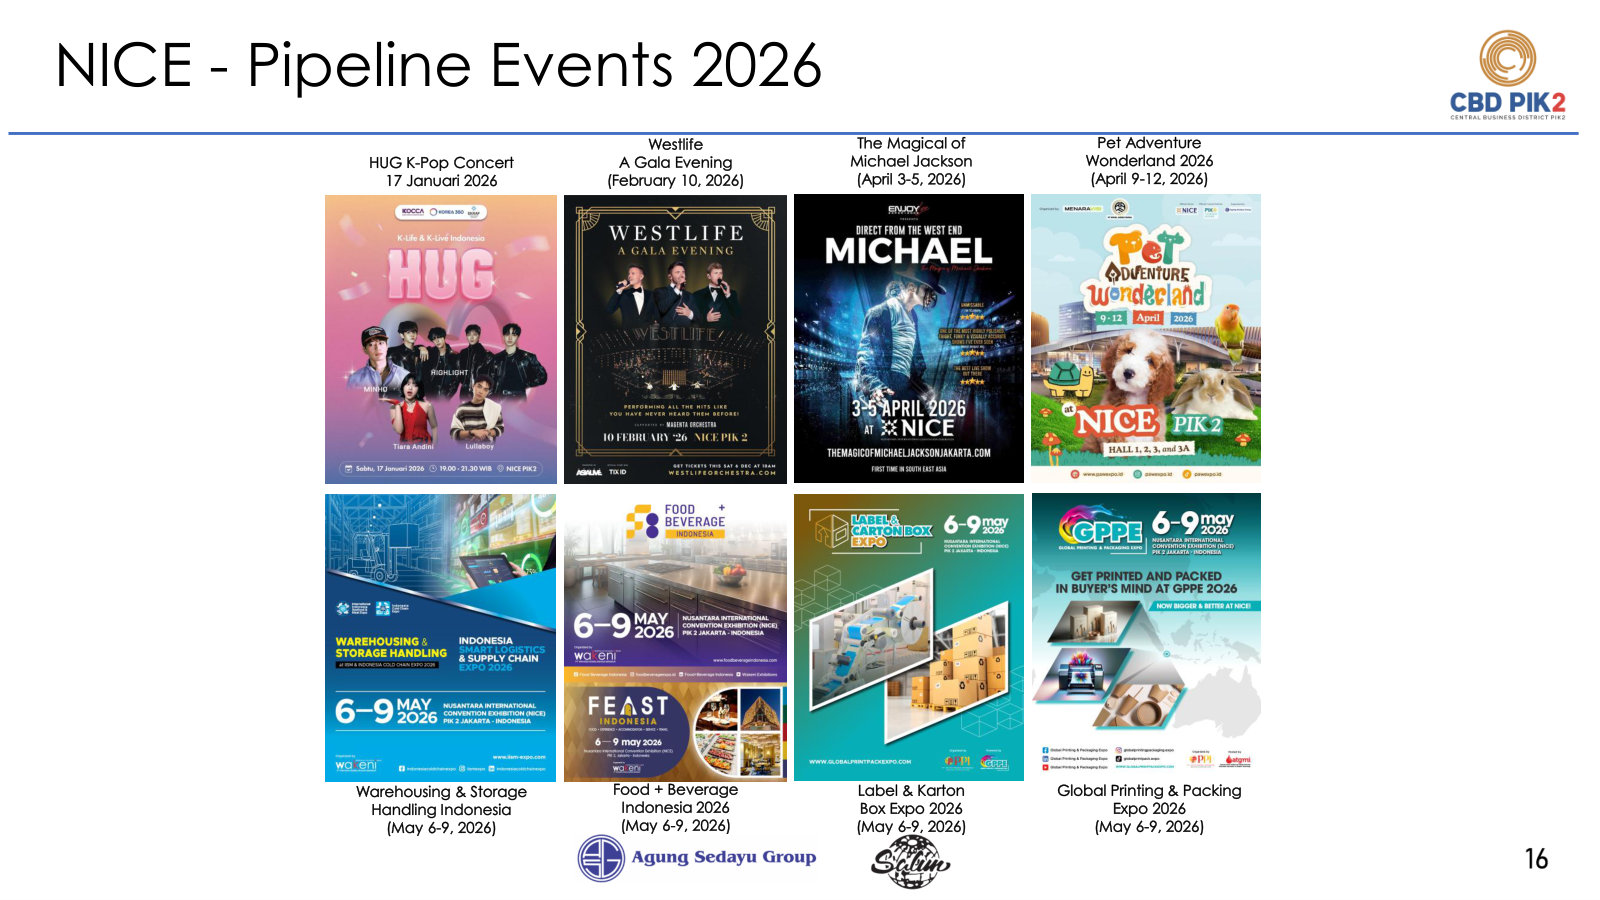
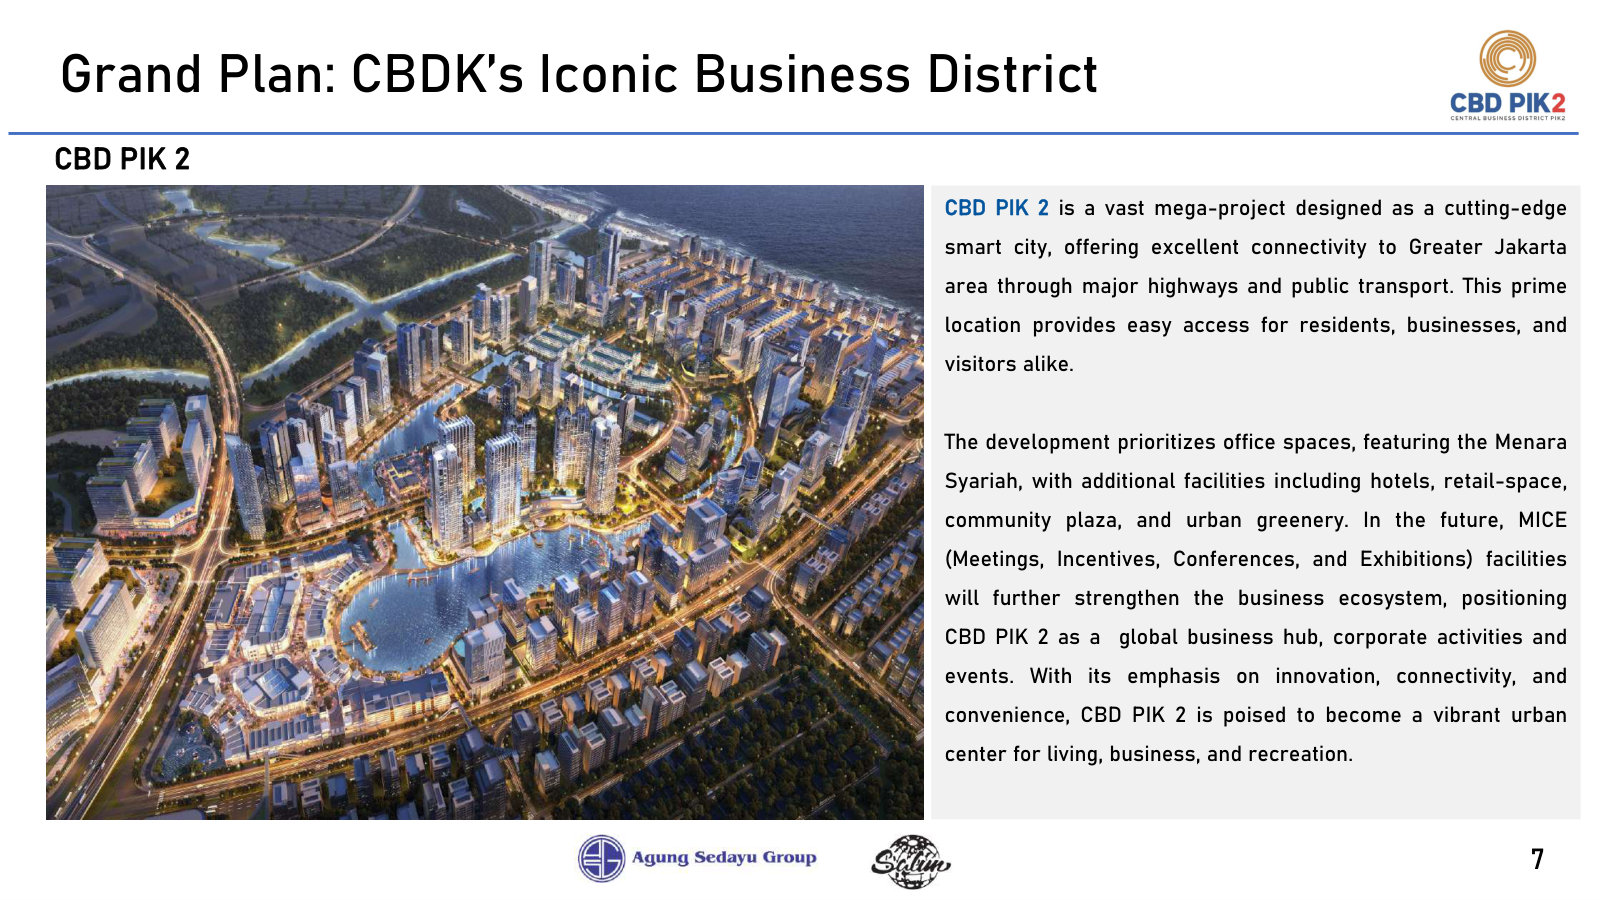
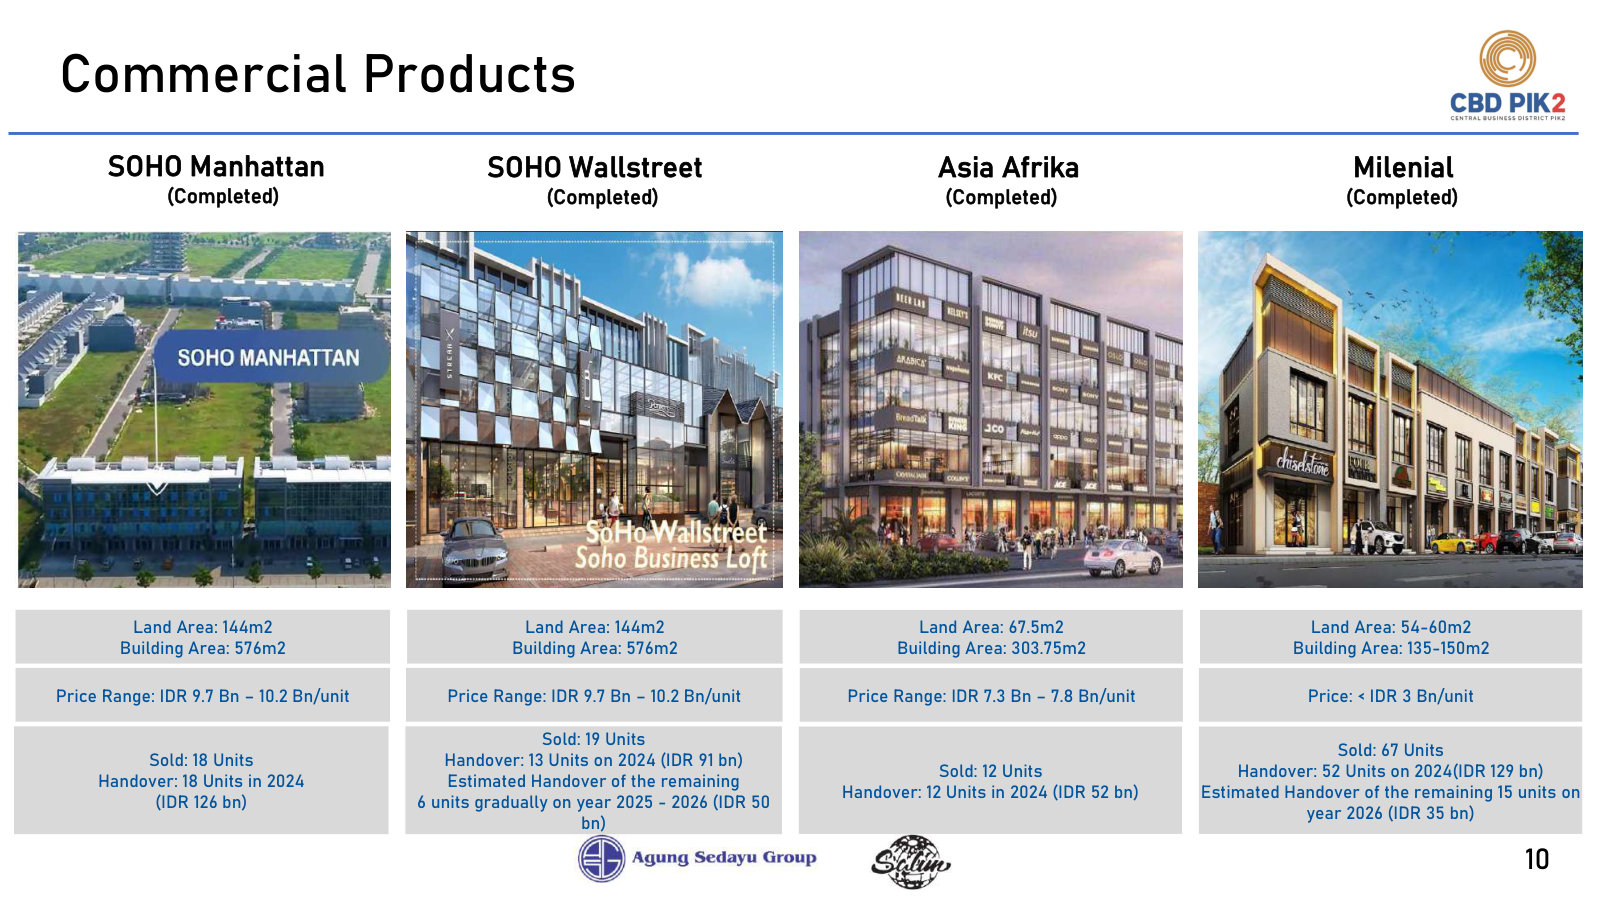
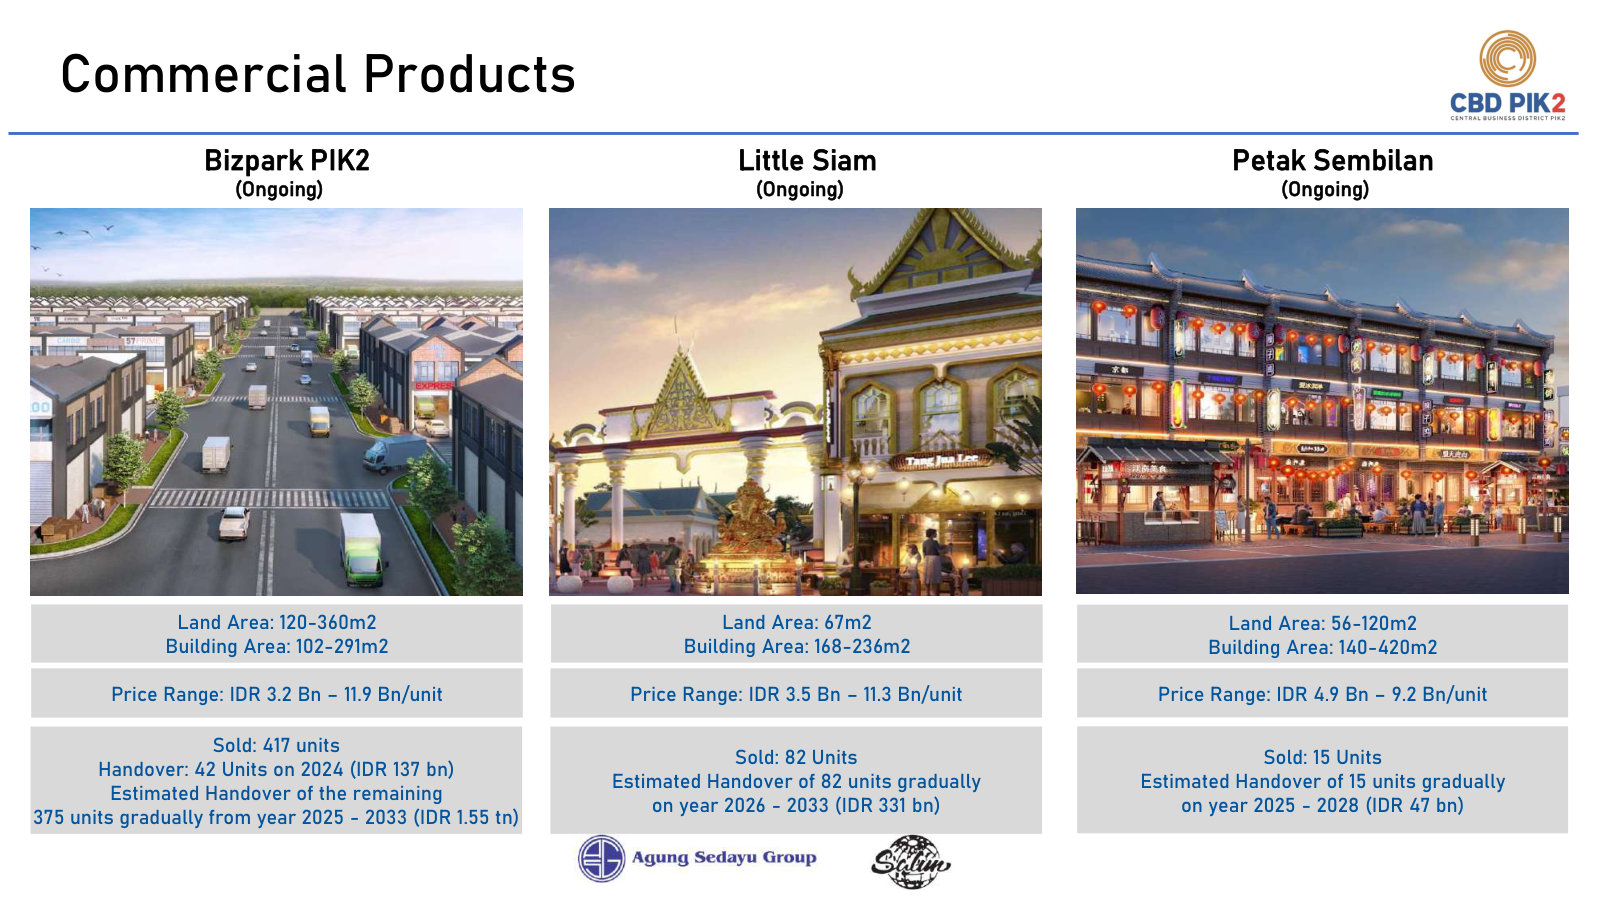
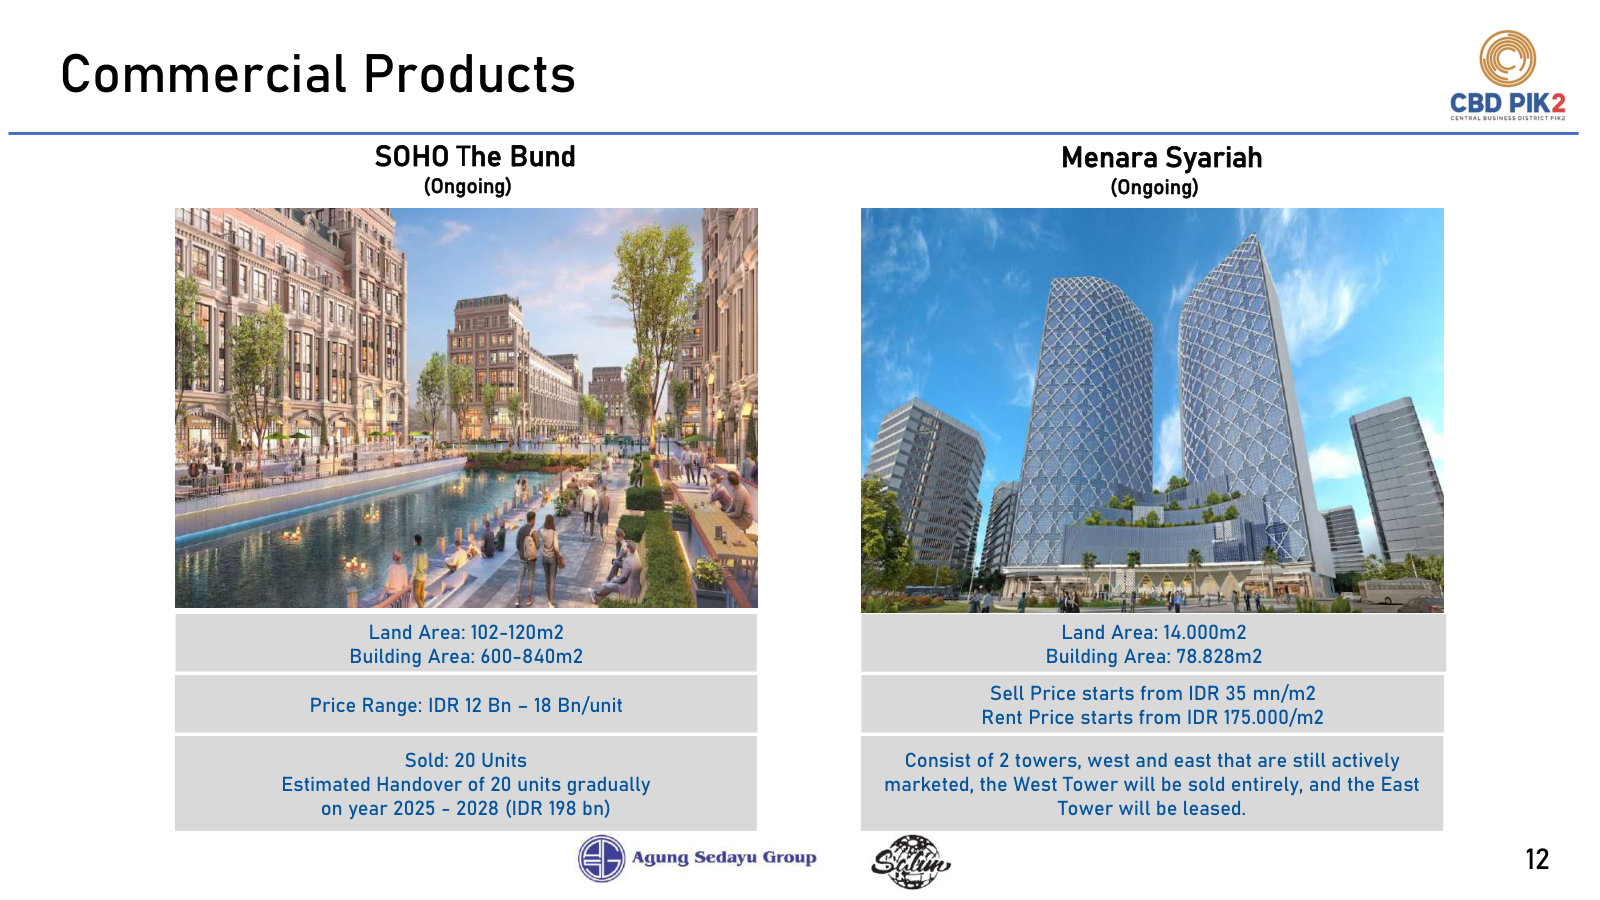
PT Bangun Kosambi Sukses Tbk's management explains the business in its own materials. The slides below do the most of that work, pulled from the documents preserved in Sources. Each source link opens the complete presentation at that slide in a new tab.
Company Presentation - January 2026 — Jan 2026
The current corporate deck: what CBDK owns, who controls it, how the landbank and the new convention centre fit together, with 9M25 numbers. · Open the full document →
Company Presentation - May 2025 — May 2025
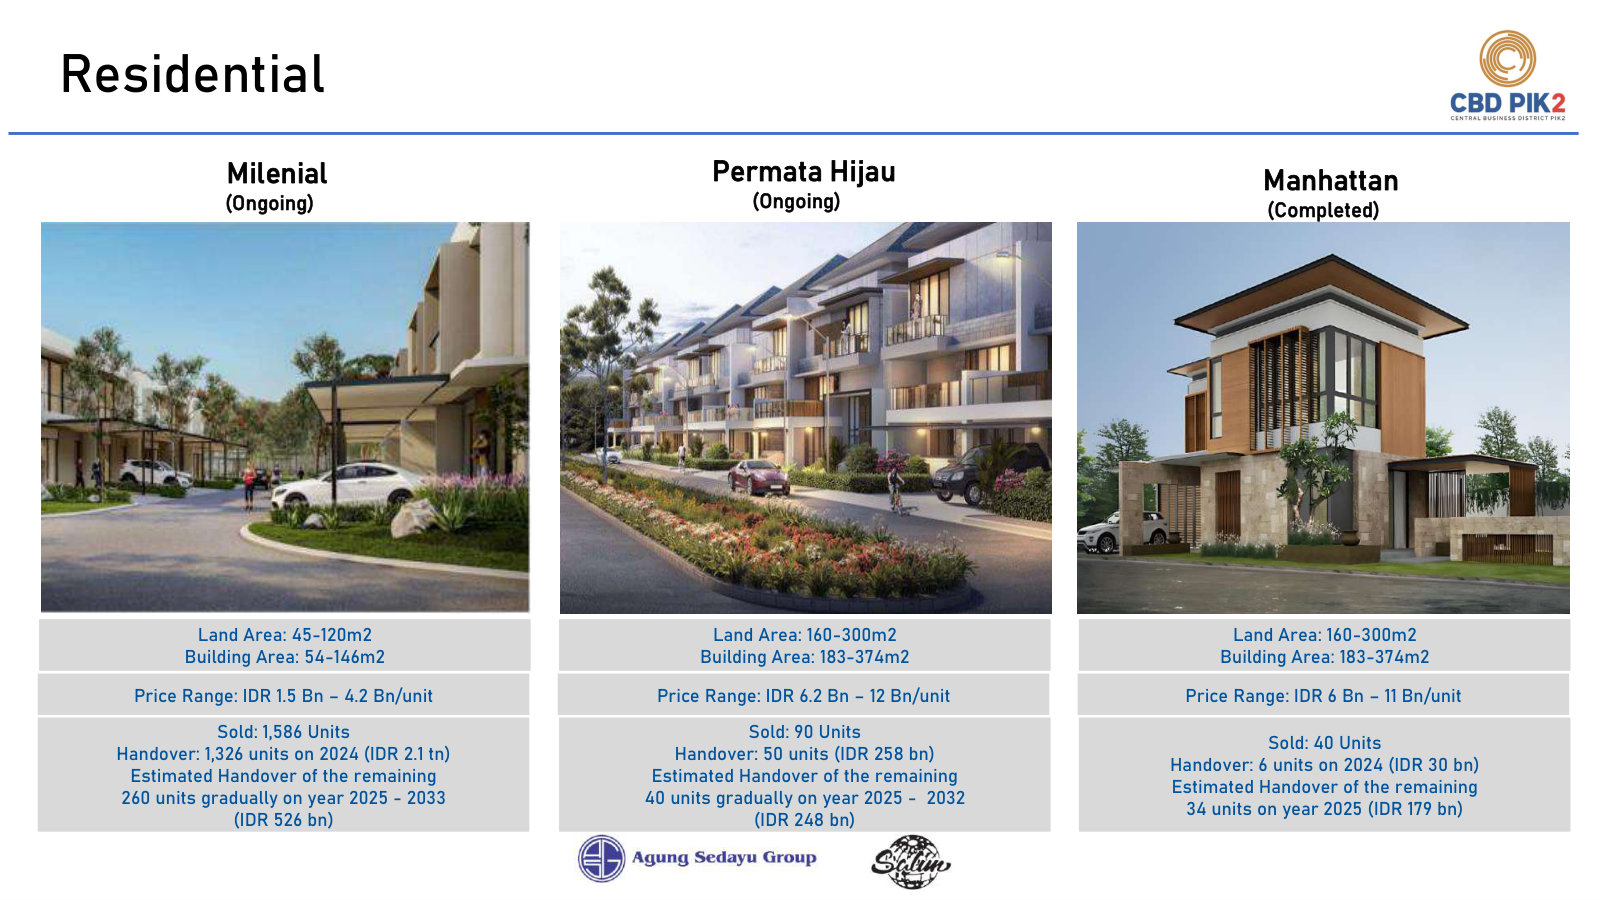
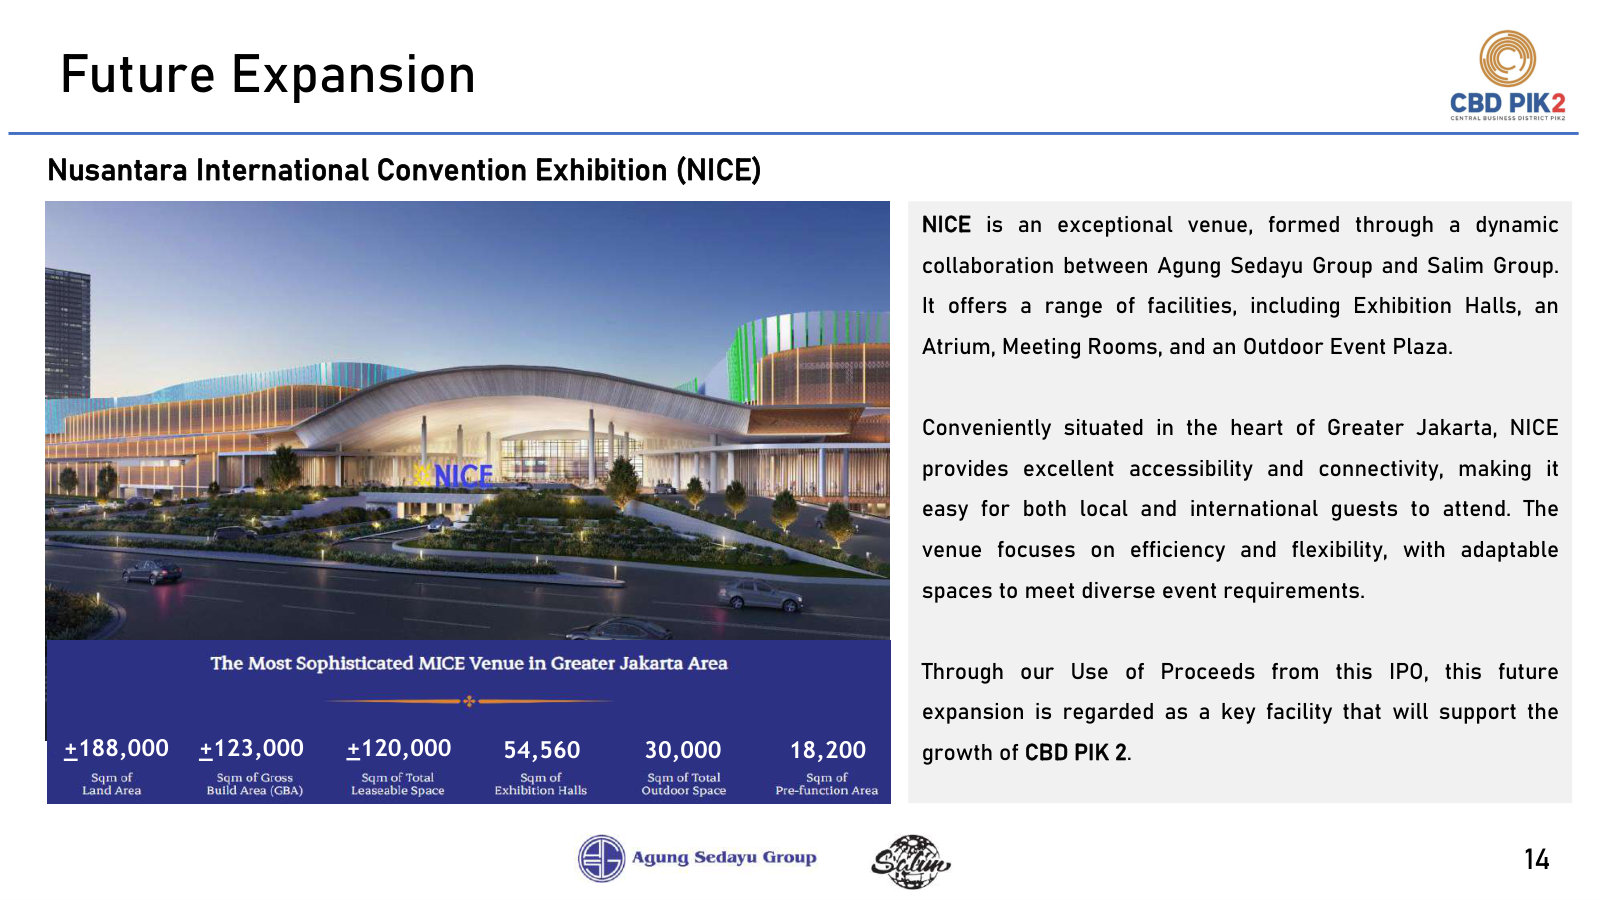
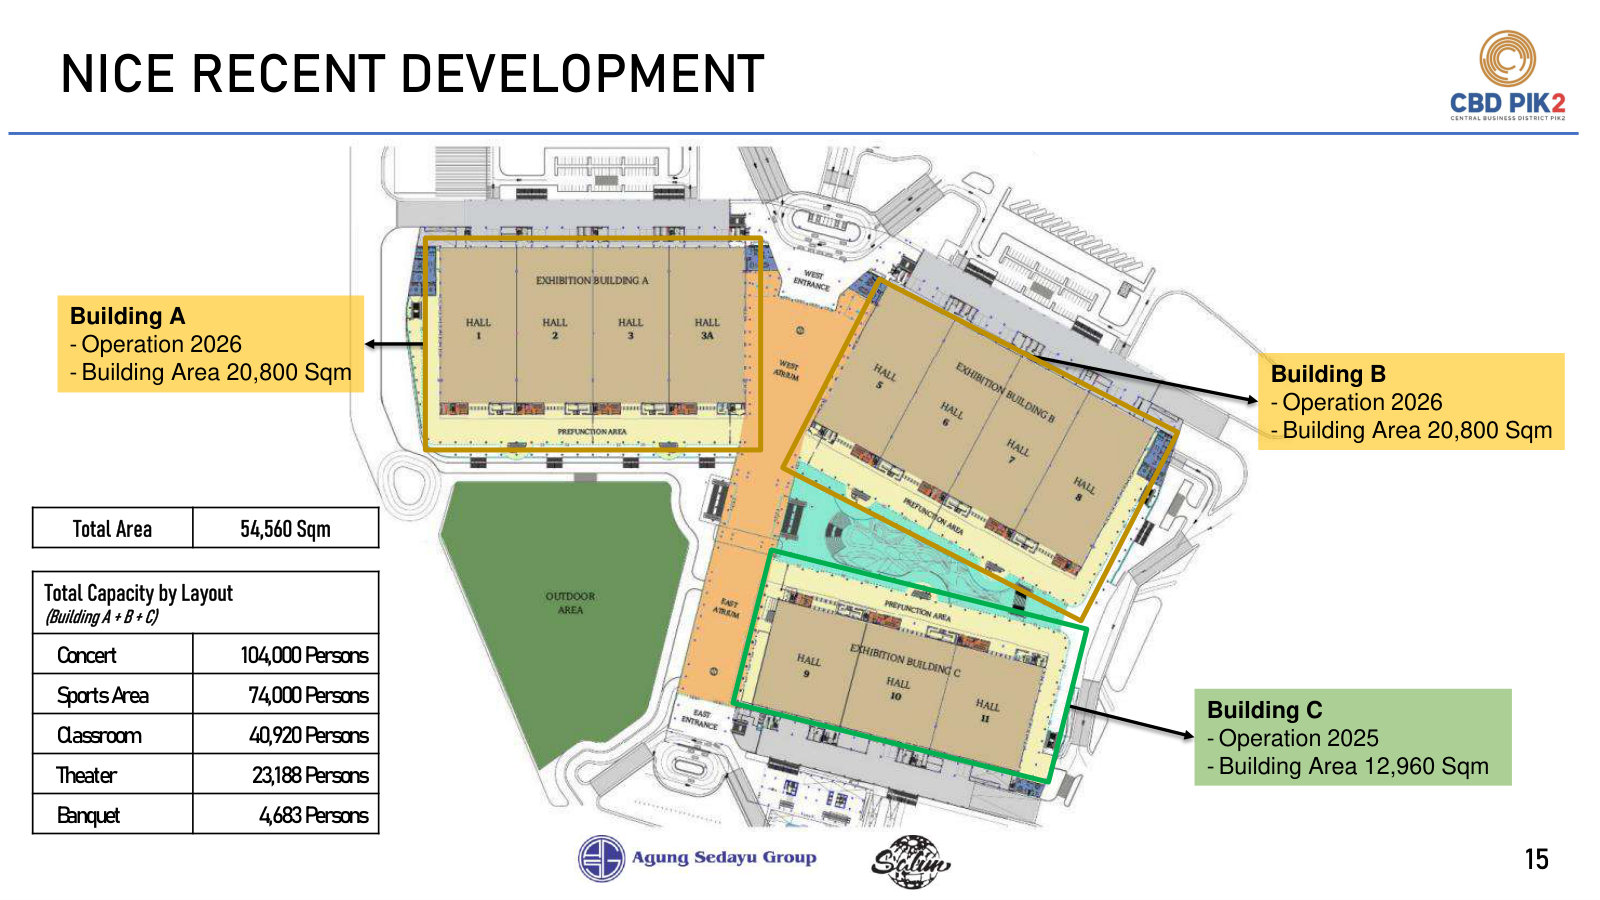
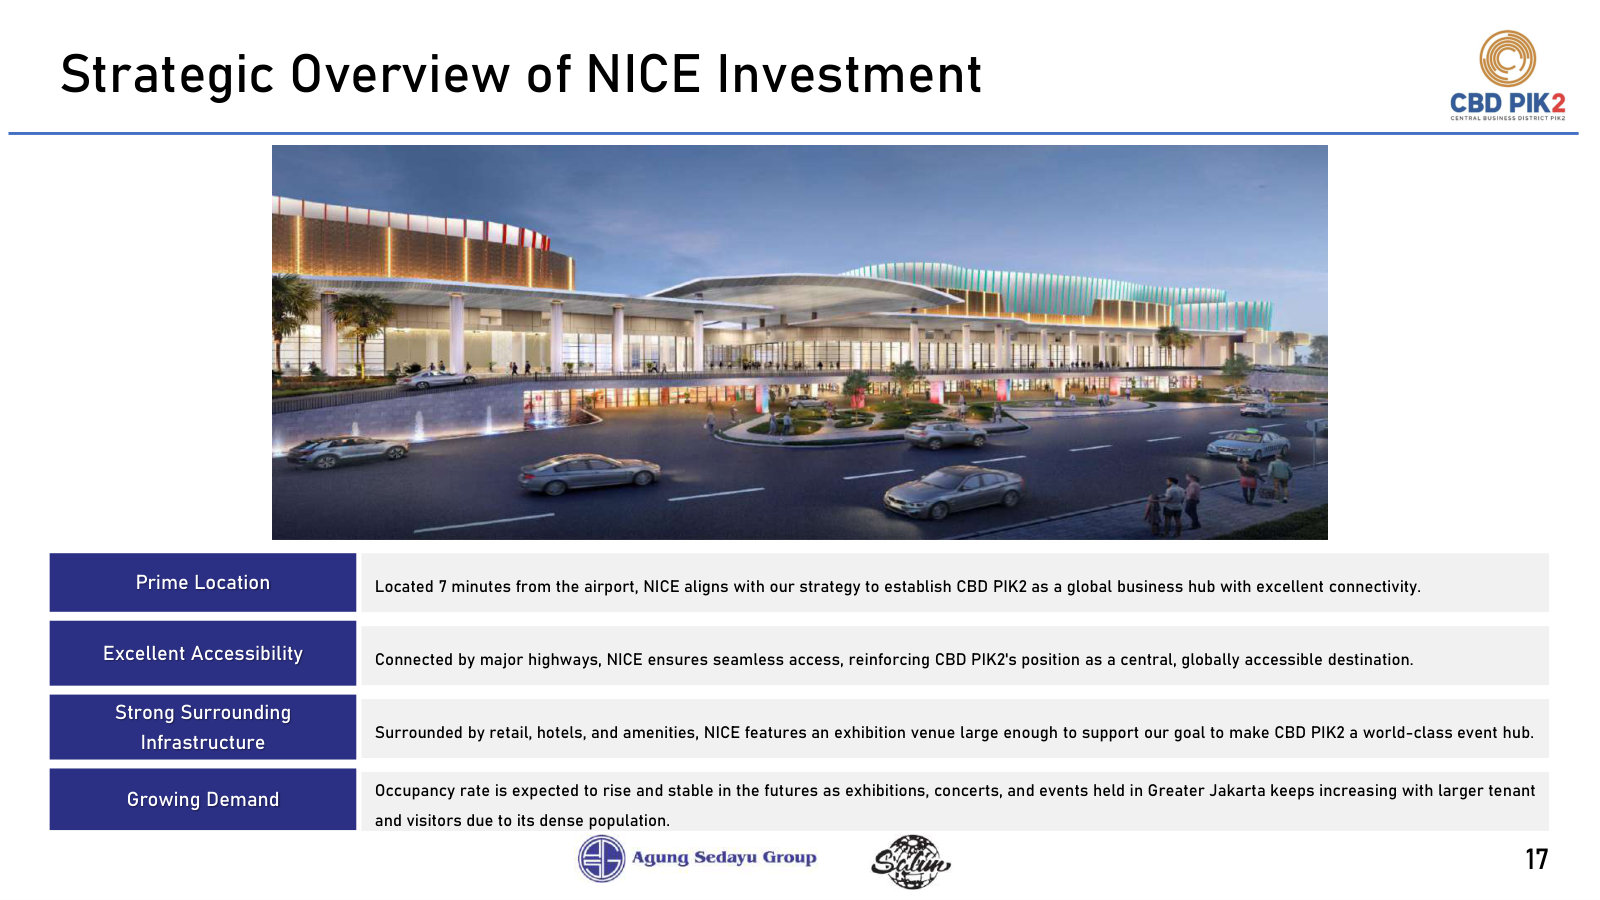
The fuller post-IPO deck: units sold and handover schedules by project, the NICE build case, and the only peer table management publishes. · Open the full document →
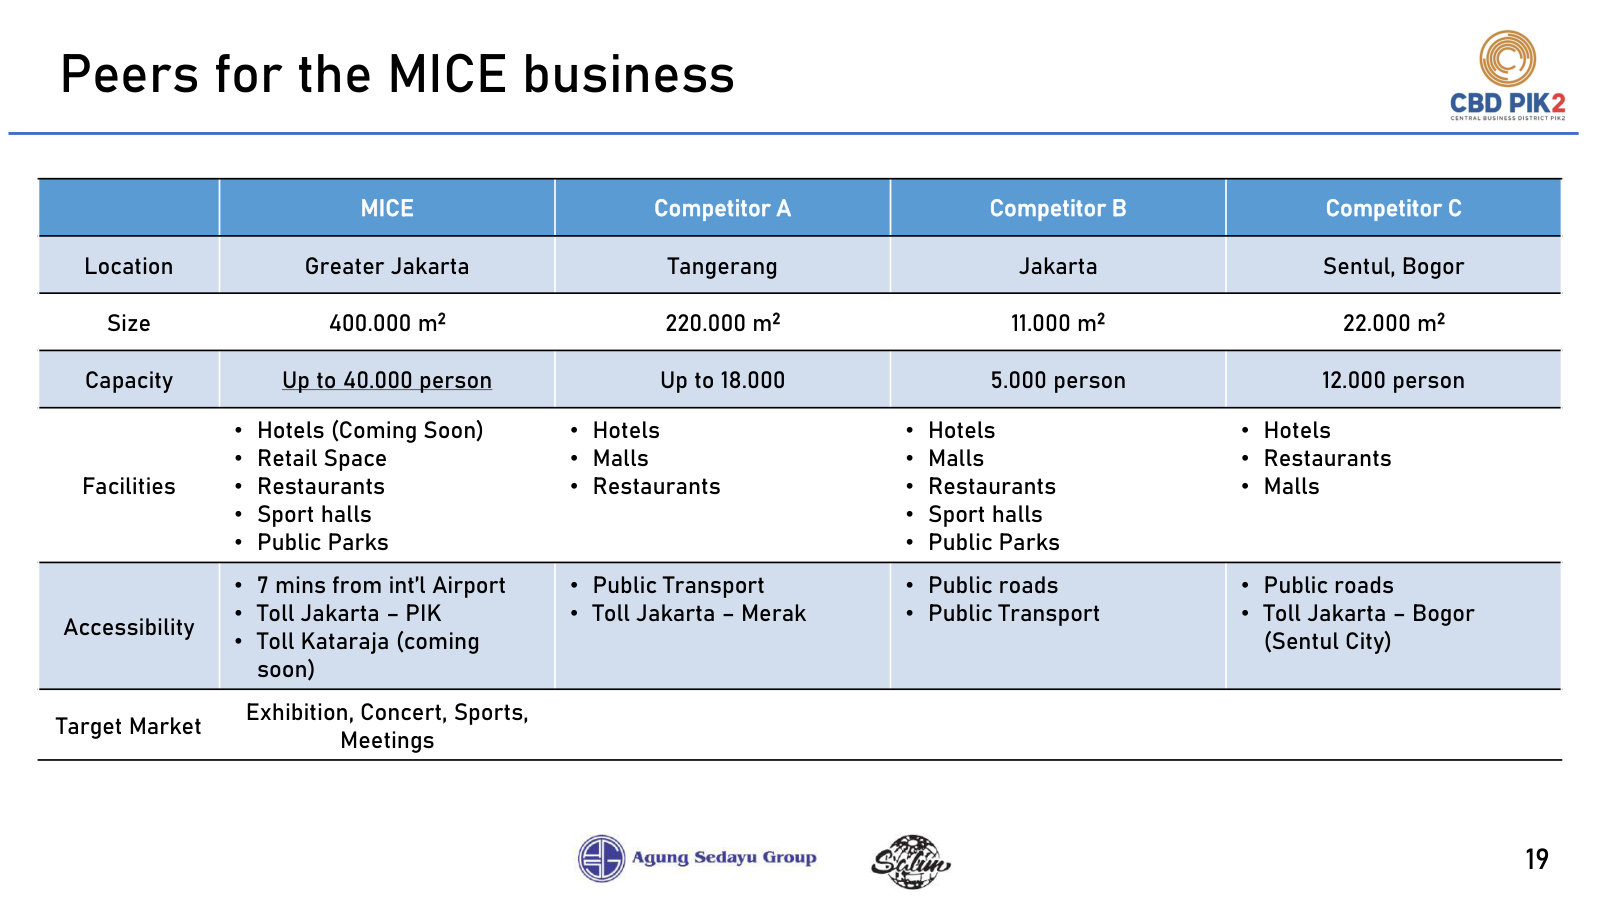
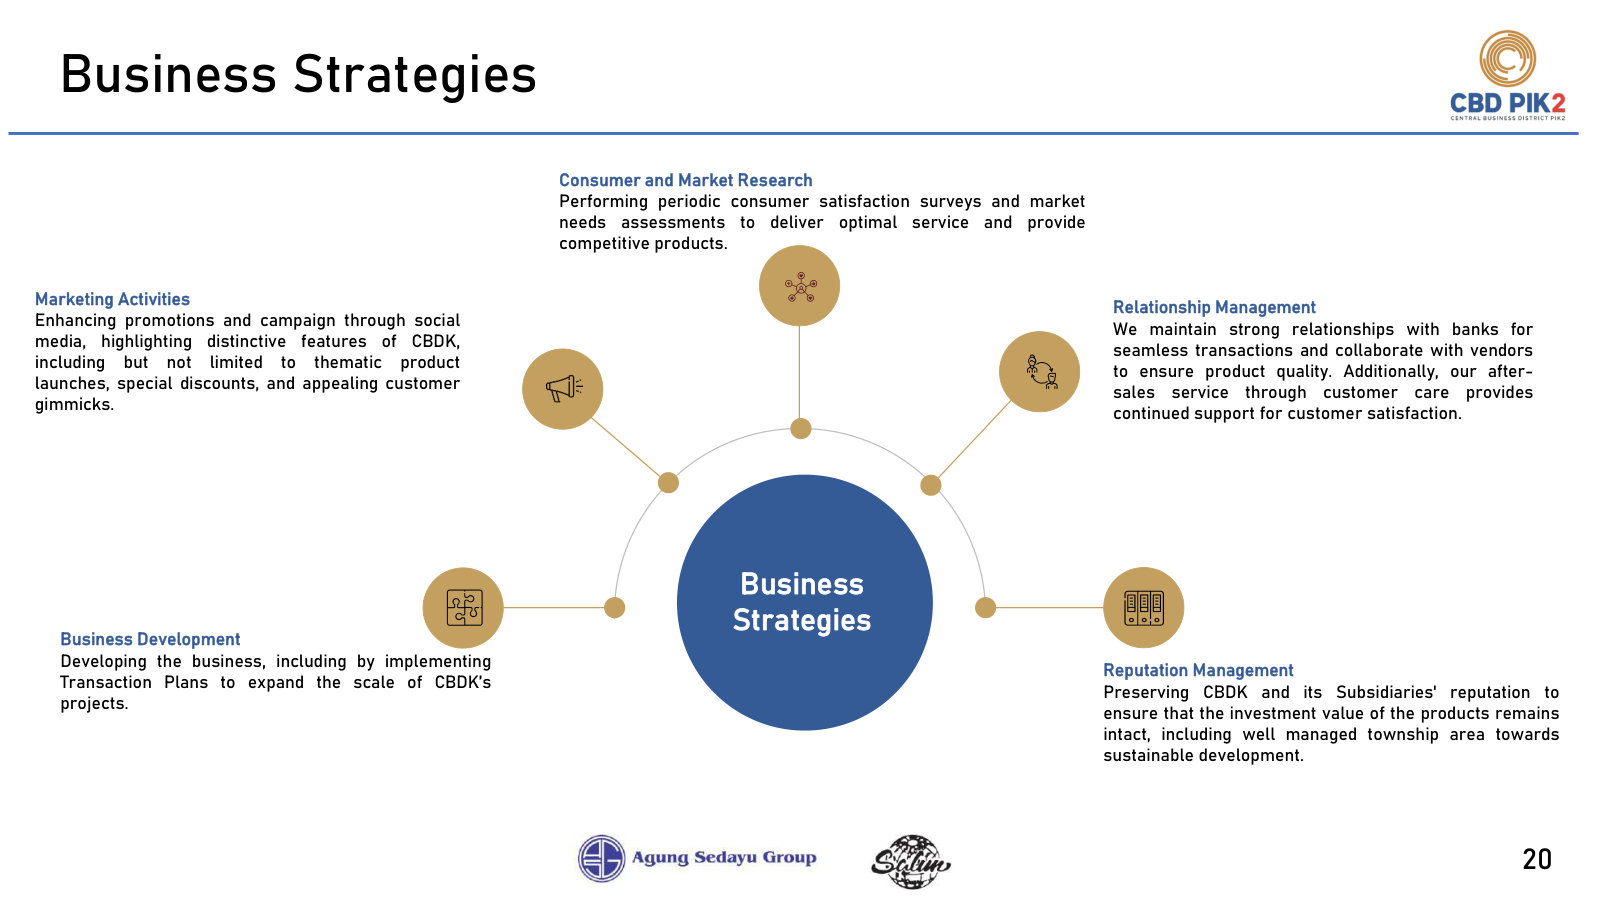
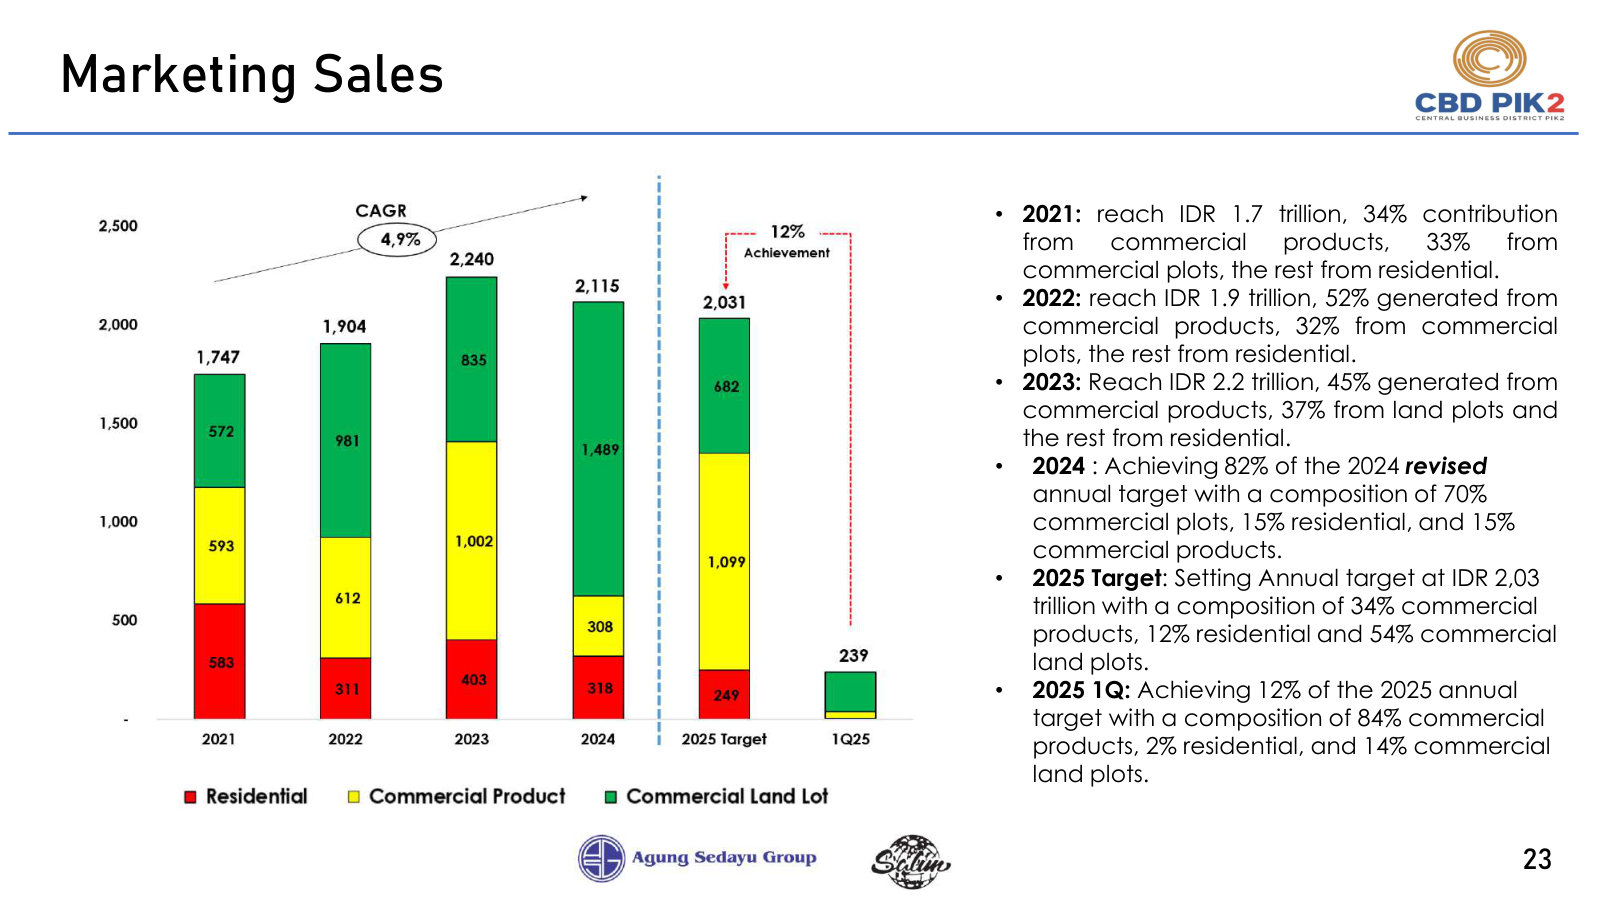
More from management
Company Presentation - February 2025 — Feb 2025 · 23 pages · Full-year 2024 marketing sales of IDR 2.1tn against a IDR 2.6tn target, plus 2021-2024 balance sheet and income statement charts. · Open →
Company Presentation - January 2025 (IPO) — Jan 2025 · 23 pages · The deck CBDK listed on: a 735 ha landbank, 9M24 financials and the project portfolio as pitched to IPO buyers. · Open →
PT Bangun Kosambi Sukses Tbk's annual reports contain management's most considered account of the business. These are the sections, passages and visual pages worth opening in the originals preserved in Sources.
PT Bangun Kosambi Sukses Tbk — 2025 Annual and Sustainability Report — FY2025
First full year as a listed company: three reported segments where there was one, and the IPO proceeds spent on an affiliate. · Open the full document →
Bidang Usaha / Business Lines — p. 64 · Read the full section →
The chartered scope and the actual FY2025 activity, plus the map of which product sits in which legal entity.
What the company actually did in 2025, in its own words.
In 2025, the Company operated in the residential and commercial real estate development sector, encompassing the purchase, sale, leasing, and operation of real estate properties, whether owned or leased, residential buildings, and non-residential properties (such as warehouses, malls, and shopping centers), as well as the provision of houses and apartments, furnished or unfurnished, for permanent or long-term use on a monthly or yearly basis. The Company’s activities also cover land sales, property development for self-operation (leasing of building spaces), land subdivision into plots without land development, and operation of residential areas for movable or modular homes. Business activities of the Company’s subsidiaries include convention and hotel exhibition.
p. 64 · Read in context →
Entitas Anak, Entitas Asosiasi, dan Ventura Bersama / Subsidiaries, Associates, and Joint Ventures — p. 89 · Read the full section →
Ownership chart plus a status column showing four of seven subsidiaries were still not operating at year-end.
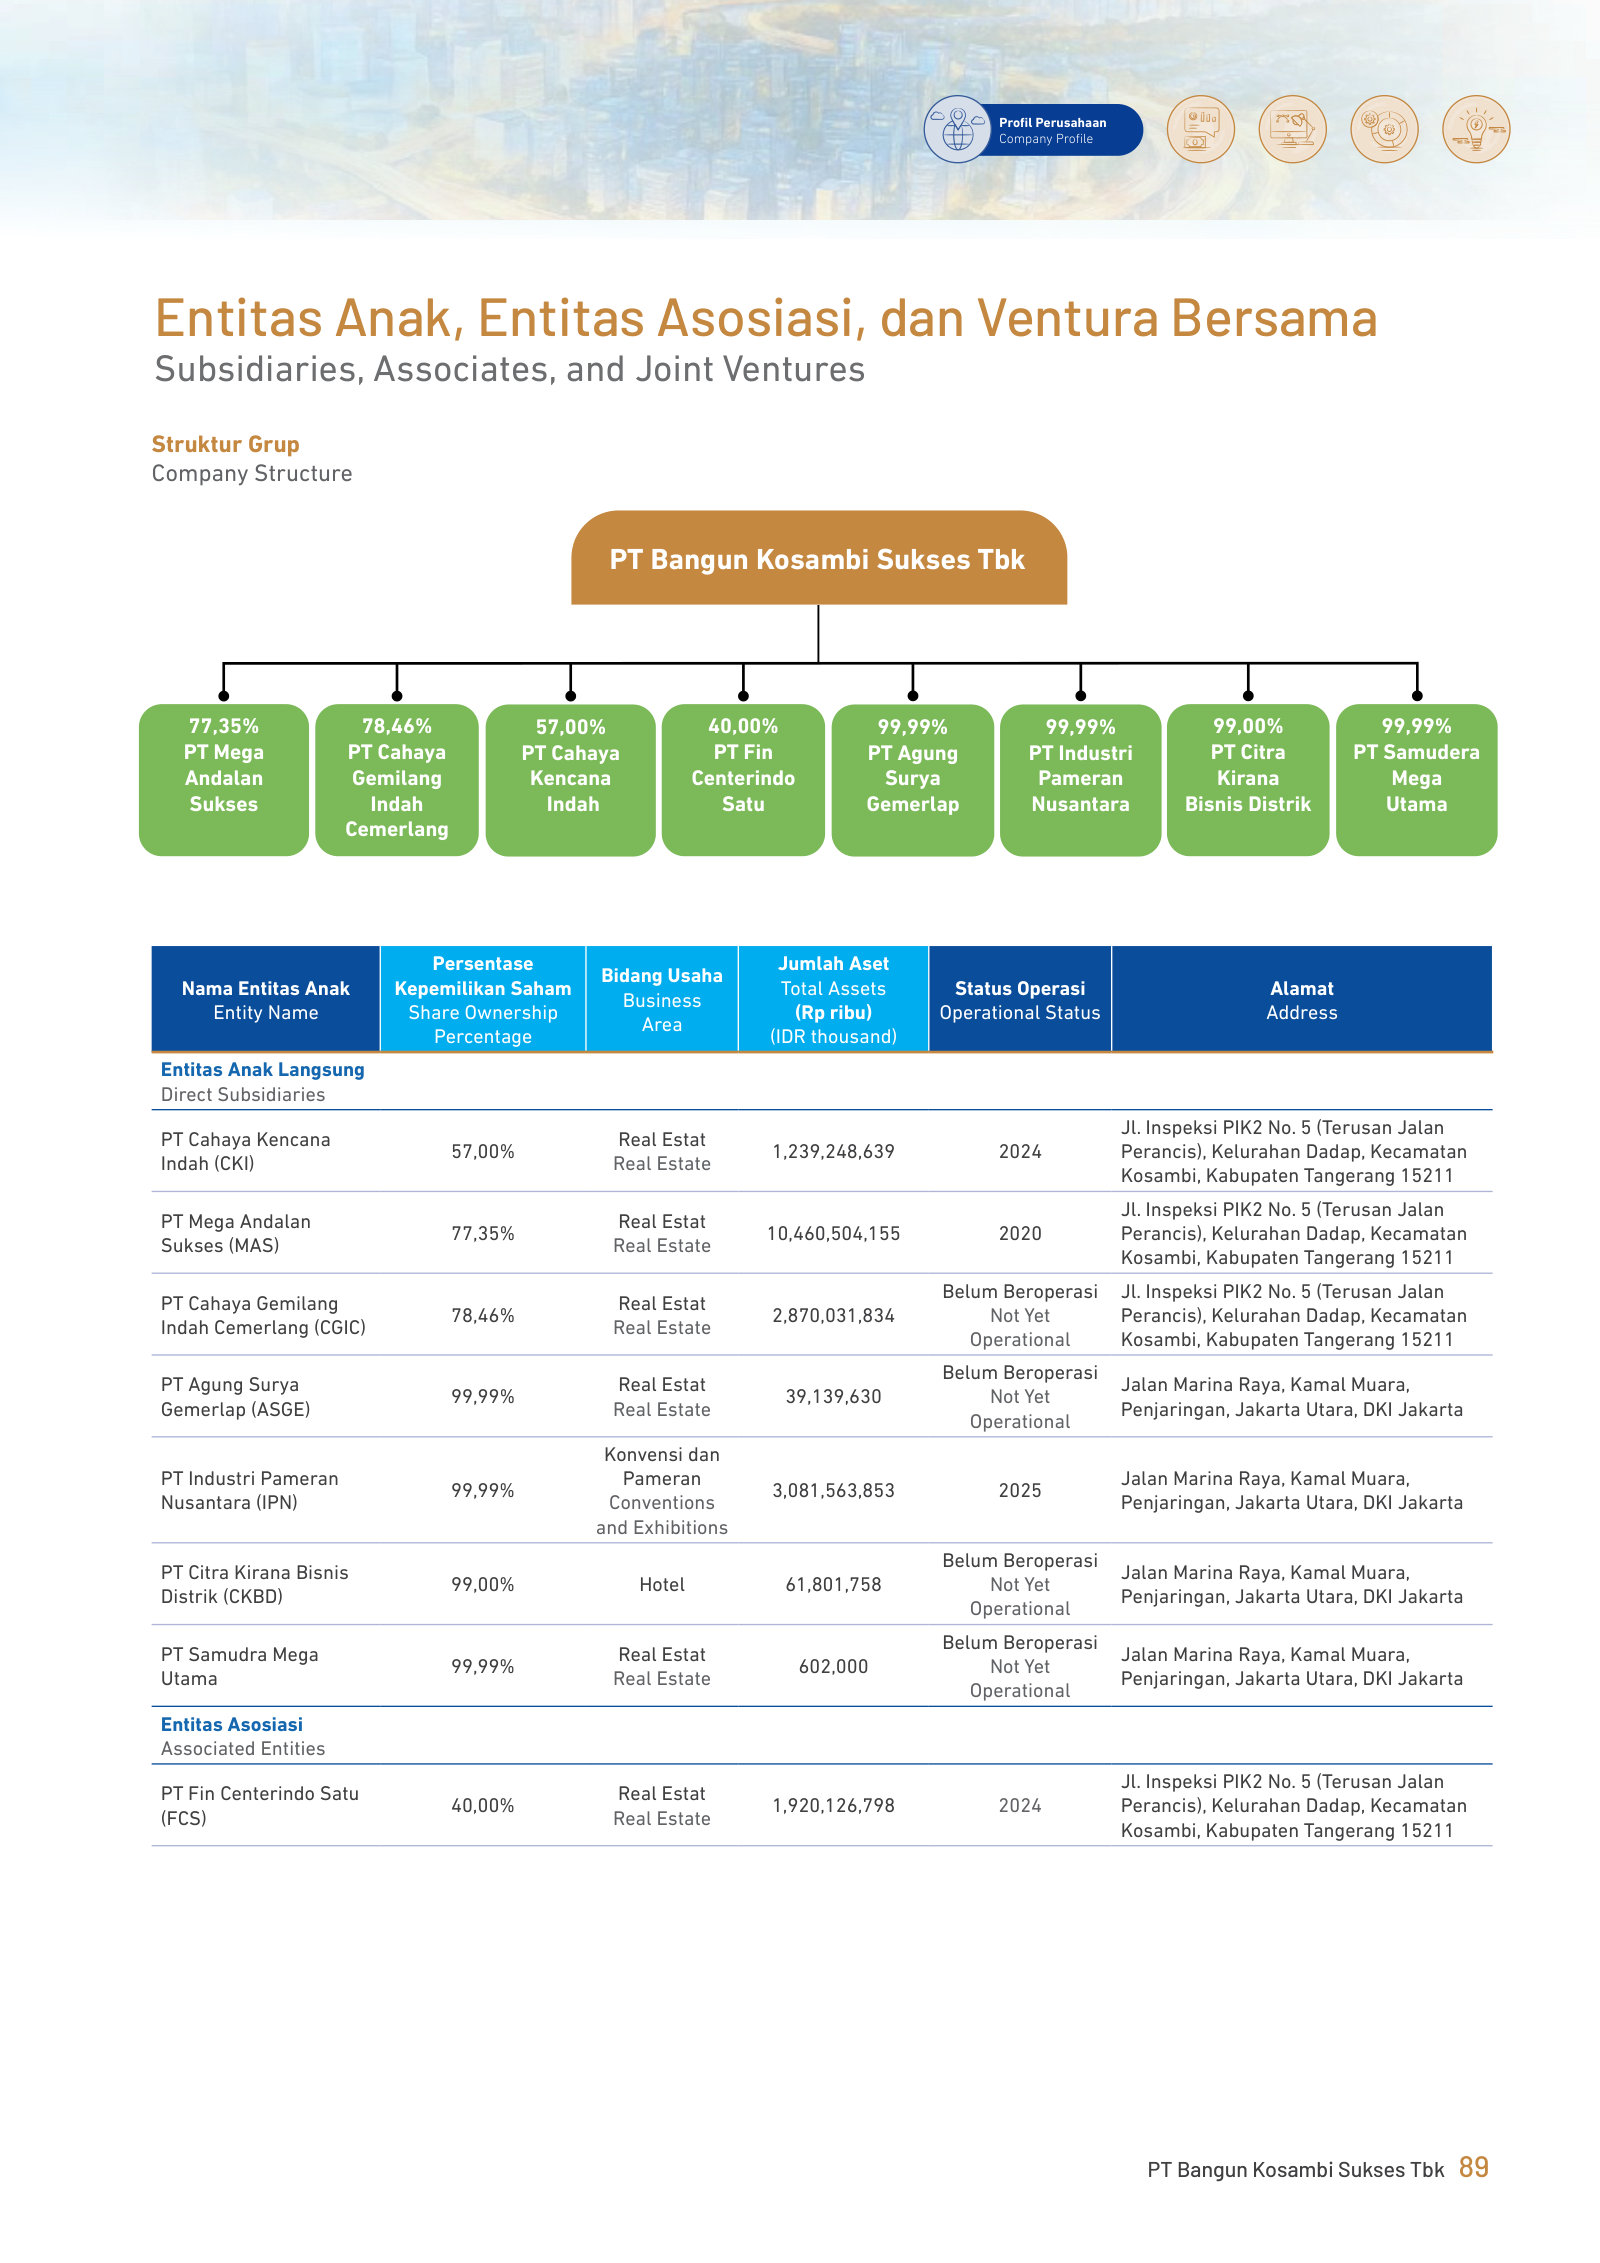
Tinjauan Operasi per Segmen Usaha / Review of Operations by Business Segment — p. 100 · Read the full section →
Where the economics live: three product groups with stated price bands, and gross margins that differ by 40+ points.
The business model as management defines it, with price ranges per product group.
The Company and its subsidiaries focus on developing integrated real estate–based township areas, covering a wide range of activities from construction and area development to the management and marketing of residential and commercial properties. The Company’s primary development area is located in the strategic PIK2 district, Tangerang, which is recognized as one of the highest-growth and highest-value property zones in the Greater Jakarta (Jabodetabek) region. […] The Company’s business model is divided into three main product groups: […] Residential products include the development of landed housing targeted at the middle-to-upper market segments, including projects such as Permata Hijau Residences, Manhattan Residences, and Rumah Milenial. These housing units are marketed at price ranges starting from IDR 1.5 billion to IDR 16 billion per unit […] Selling prices vary from IDR 3.2 billion to IDR 18 billion per unit depending on size and location. […] In addition, the Company develops and markets commercial land plots for investors and business operators who require flexibility in designing their buildings and spatial functions.
p. 100 · Read in context →
Segmen Konvensi dan Pameran / Convention and Exhibition Segment — p. 103 · Read the full section →
The two new segments added in 2025 — NICE, which began earning, and the hotel, which has not.
NICE: stated capacity and the 14 events held in its first year.
In 2025, the Company began developing and operating the convention and exhibition segment (MICE) as part of its business diversification strategy and eforts to enhance the value of the township. The main facility developed in this segment is the Nusantara International Convention and Exhibition (NICE), designed to become one of the largest and most representative convention centers in North Tangerang, particularly within the PIK2 area. […] NICE has an efective capacity to accommodate more than 100,000 visitors simultaneously, with flexible room configuration options for various event scales, ranging from trade exhibitions, product launches, international conferences, to community-based events. […] Throughout 2025, the convention and exhibition segment recorded positive developments. A total of 14 events were successfully held
p. 103 · Read in context →
Hotel segment (p.106): Hilton PIK2, 271 rooms, opening 2027, no revenue recorded yet.
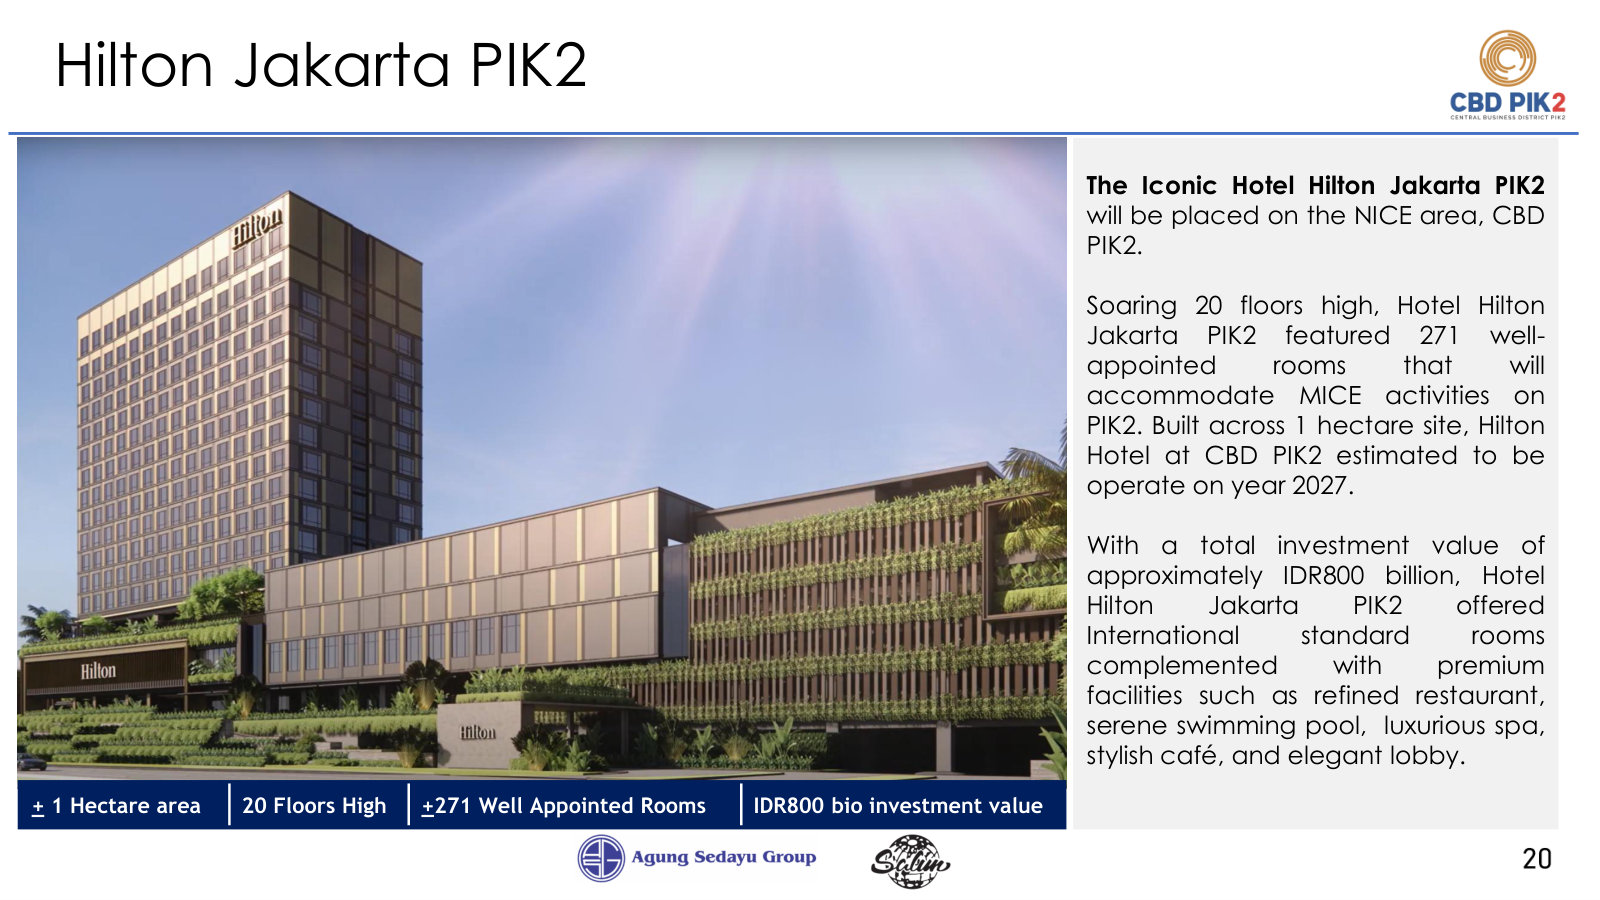
In 2025, the Company formally expanded its business portfolio into the hospitality industry segment through a strategic agreement with the global hotel network PT Hilton International Manage Indonesia and Hilton Worldwide Manage Limited. This partnership introduces an international five-star hotel project, Hilton Hotel PIK2, developed within the prestigious NICE district at PIK2. […] The hotel is designed to rise 20 floors high and provide a total of 271 exclusive rooms […] The hotel is scheduled to open in 2027. […] As of the end of 2025, Hilton Hotel PIK2 is still under ongoing development, therefore the hotel segment has not yet recorded any contribution to the Company’s Revenue.
p. 106 · Read in context →
Laporan Laba Rugi Konsolidasian / Consolidated Statement of Profit or Loss — p. 109 · Read the full section →
Management explains why gross profit rose 30% on 11% revenue growth: mix, not price.
Cost of revenue fell while revenue rose — management attributes both to the land-plot mix.
The Company’s cost of revenue was recorded at IDR 850.04 billion in 2025, a decrease of IDR 126.58 billion or approximately 12.96% compared to the 2024 position of IDR 976.61 billion. This decline was mainly due to the fact that the volume of deliveries throughout 2024 was dominated by the commercial land segment, which recorded a lower cost of revenue than the other segments, namely residential and commercial products. […] The Company’s gross profit for 2025 was recorded at IDR 1.65 trillion, an increase of IDR 381.24 billion or 29.96% from the previous year’s figure of IDR 1.27 trillion. This performance was driven by the commercial land segment, which generated a higher gross profit margin than the residential and commercial product segments.
p. 110 · Read in context →
Perbandingan Target dengan Realisasi Tahun 2025, serta Proyeksi 2026 / Comparison of Targets with 2025 Realization and 2026 Projections — p. 120 · Read the full section →
Marketing sales came in at 84.67% of target, with residential at 36.76%; the 2026 residential target is 31x the 2025 result.
Informasi Material Terkait Investasi, Ekspansi, Divestasi, Merger, Akuisisi, dan Restrukturisasi Utang / Material Information Related to Investment, Expansion, Divestment, Merger, Acquisition, and Debt Restructuring — p. 128 · Read the full section →
The whole IPO net proceeds, Rp2.30 trillion, went to acquire an affiliate held by the same controlling shareholders.
Management's stated rationale for buying the MICE entity from affiliated parties.
The Company’s decision to invest in PT IPN was based on the fact that the MICE project development has been carried out by PT IPN, which was established to focus on the development of the MICE business. […] After considering the background of the Transaction, the Company is confident that conducting the Transaction with an afiliated party allows the implementation process to be carried out more eficiently and with competitive pricing compared to if the Transaction were conducted with another unafiliated party.
p. 129 · Read in context →
Hal Audit Utama — Pengakuan Pendapatan / Key Audit Matters — Revenue Recognition — p. 346 · Read the full section →
The auditor's own account of the judgment that sets when a sale becomes revenue: handover, not contract.
Point-in-time recognition on transfer of control — the policy that shapes reported revenue timing.
The Group's revenues mainly comprise of real estate revenue through sales of land plots, residential houses and office houses. Measurement and recognition of revenues, and related policies and procedures are significant to our audit because the revenue is material to the Consolidated Financial Statements and the Group's revenue recognition required the management to apply significant judgment, especially in determining revenue recognition at a point in time based on point in time transfer of the control of the asset (at a point in time satisfaction of performance obligation). […] Revenue from the sale of inventories is recognized at a point in time when inventories are delivered to the customers. The timing of revenue recognition requires judgment on whether the Group has transferred significant risks and rewards of ownership in the inventories to the customers and whether the Group has a substantial continuing involvement with the inventories.
p. 346 · Read in context →
Catatan 21. Saldo dan Transaksi Material dengan Pihak Berelasi / Note 21. Material Balances and Transactions with Related Parties — p. 412 · Read the full section →
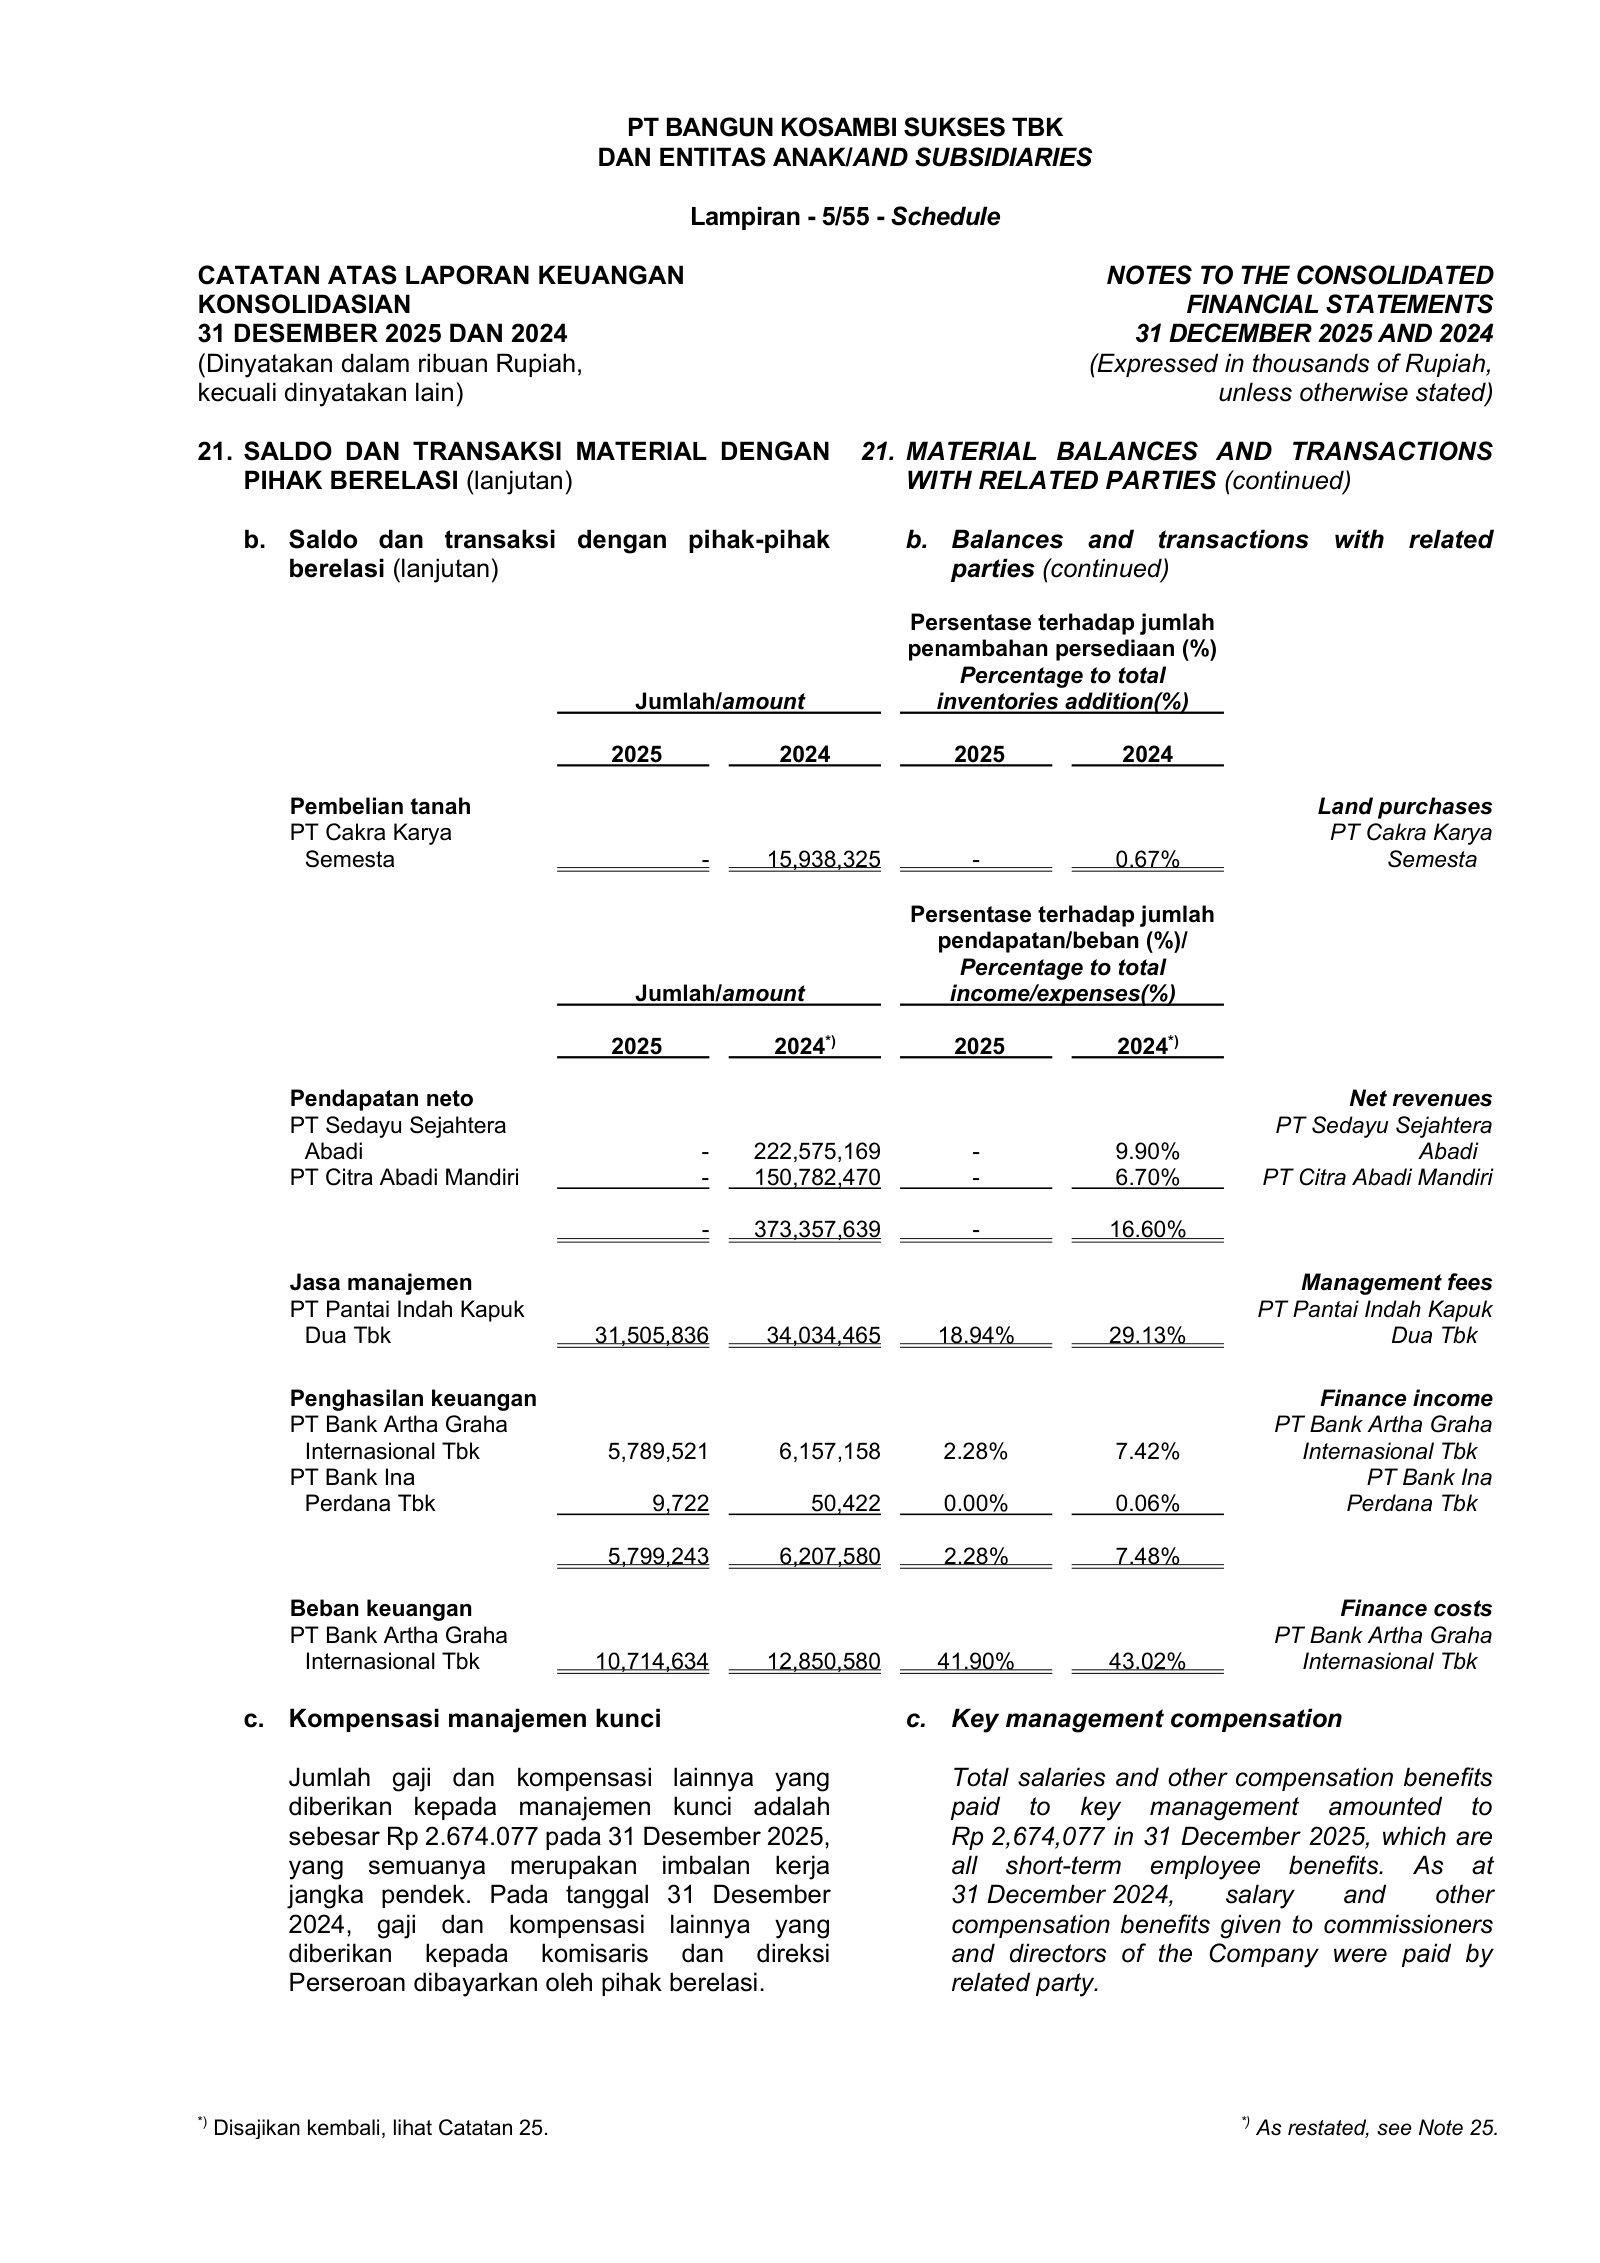
Scale of the affiliate web: 16.60% of restated FY2024 revenue was to related parties, and Rp538bn of customer advances still are.
PT Bangun Kosambi Sukses Tbk — 2024 Annual Report — FY2024
The last pre-IPO edition: a business described as real estate only, reported as one segment in one geography. · Open the full document →
Catatan 27. Segmen Operasi / Note 27. Operating Segment — p. 260 · Read the full section →
One sentence that FY2025 Note 22 replaces with a four-column table — the segment redefinition in the original.
FY2024: a single segment, a single geography.
Management managed and categorised Group into one segment, which is real estate. […] All of the Group’s sales are in the same geographic area which is Tangerang.
p. 260 · Read in context →
Competitors describe PT Bangun Kosambi Sukses Tbk's market in their own filings and calls. These verified passages and visual pages show where their strategies meet, using source documents preserved in Sources.
PT Bumi Serpong Damai Tbk (BSD City, Sinar Mas Land) (BSDE)
Named in CBDK's own prospectus as a competitor and the closest structural analogue to PIK2: a self-contained mega-township with its own CBD in Tangerang, selling landed homes, shophouses, apartments and commercial land to the same Greater Jakarta middle-upper buyer, and monetising land through joint ventures the same way CBDK does.
BSD City's scorecard for 2025: marketing sales hit the headline target, but only because land sales to joint ventures filled a large shortfall in both residential and commercial pre-sales, and profit came in at roughly half of plan.
This year, the Company has successfully exceeded the marketing sales target set at the beginning of the year. The marketing sales achievement this year was IDR10.04 trillion or 100.4% compared to the 2025 target of IDR10 trillion. Residential marketing sales in 2025 were IDR4.19 trillion, or 82% of the IDR5.1 trillion target. Commercial marketing sales were IDR3.73 trillion or 76% of the target. Meanwhile, others also served as a significant contributor, amounting to IDR2.13 trillion or 21% of total 2025 marketing sales. The Company also managed to record Revenues of IDR12.79 trillion, 92,65% of the initial target set IDR13.80 trillion. In line with that, the Company’s Profit for the Year was recorded at IDR2.86 trillion or 48.39% of the initial target set at IDR5.90 trillion.
p. 161 · Read in context →
BSD City's board sets a flat Rp10tn pre-sales target for 2026 and describes the market it shares with PIK2 as a moderate recovery rather than an expansion — its stated view, not a forecast for the sector.
Additional challenges are anticipated within the investment sector. Property investment growth is expected to be moderate rather than expansive, highlighting the necessity for product differentiation and cost efficiency strategies, which will be crucial elements in property-related decision-making. […] According to various surveys and analyses conducted by industry experts and property consultants, the national property sector is projected to enter a recovery phase characterized by moderate growth, with varying rates across different sub-sectors. […] Considering the potential and challenges derived from the gathered data and information, the Directors with the approval of the BOC, have established a moderate marketing sales target of IDR10.00 trillion, while continuing to emphasize development in the residential sector at 50%. This target enables the Company to cultivate sustainable competitiveness grounded in prudent principles and strong risk management.
p. 23 · Read in context →
BSD City attributes its market position to township credibility, partner joint ventures and design, and discloses the unit mix behind Rp10tn of pre-sales — 1,331 residential units, 221 apartments and 547 shophouses, the same product set CBDK sells in the PIK2 CBD.
The increasingly trusted of sustainable development in the area, combined with collaboration with strategic partners, innovative funding and consistently attractive and up-to-date design concepts, have effectively strengthen the Company’s position and market share within the industry. This year, the Company reported marketing sales totaling IDR10.04 trillion. In the residential segment, marketing sales reached IDR4.19 trillion, derived from 1,331 units across all the Company’s townships, including the Rancamaya area. Additionally, commercial marketing sales reached IDR3.73 trillion, generated from the sales of 221 apartment units and 547 shophouse units. Furthermore, land sales to joint venture companies achieved a significant value of IDR2.13 trillion.
p. 126 · Read in context →
PT Alam Sutera Realty Tbk (ASRI)
The other large-scale mixed township developer in Tangerang/Banten — CBDK's exact home market — selling landed houses, shophouses and commercial product to middle- and upper-income buyers. Its 2025 shortfall is the closest available read on how that specific catchment absorbed supply.
Alam Sutera's board reports a 30% miss against its own 2025 marketing-sales target in the Tangerang market, and attributes part of it to a longer sales cycle now that buyers are mostly end users rather than investors.
In 2025, the Company recorded marketing sales of Rp2.44 trillion, achieving 70% of the initial target set at Rp3.5 trillion. Residential product sales (including apartments) contributed significantly, accounting for 70% of this year’s marketing sales, while the 30% was generated from commercial product sales. On the revenue front, the Company recorded realized revenues of Rp2.9 trillion, which was lower than the initial target of Rp3.4–3.5 trillion set at the beginning of the year. […] From an operational perspective, the Company faced several challenges, including a longer sales cycle due to the current consumer profile being dominated by end users, increased construction costs resulting from rising prices of building materials, and dynamic shifts in consumer preferences.
p. 37 · Read in context →
Alam Sutera's stated 2026 outlook: the upper-middle residential segment above Rp1.5bn is where it sees growth, while apartments, offices and hospitality stay constrained — the split matters because CBDK's mix spans both sides of it.
The Ministry of Finance has stated that the projected improvement in economic growth in 2026 is expected to serve as a positive catalyst for business activity and property market performance. Within the commercial property segment, the apartment and office sub-segments are anticipated to experience limited growth. The hospitality sector also faces potential continued pressure stemming from ongoing efficiency-driven policies. Residential property, however, is projected to record solid growth, with the upper-middle segment, comprising properties priced above Rp1.5 billion, having recorded increased sales in 2025 and projected to sustain growth into 2026.
p. 113 · Read in context →
How Alam Sutera frames competitive risk in its formal risk register: not only rival developers but the volume of supply reaching the market — the oversupply channel a single-township developer is most exposed to.
Risiko Persaingan / Competitive Risk […] The competitive risks faced by the property industry consist of two types of risks: competitors in the same industry and the market supply. […] In facing these challenges, the Company continues to strive to provide various innovative offerings that prioritize originality, uniqueness, and high-quality products, supported by excellent service and comprehensive supporting facilities tailored to customer needs. The Company is also committed to timely product delivery.
p. 158 · Read in context →
PT Lippo Karawaci Tbk (LPKR)
Developer of Lippo Village in Tangerang, the other established large-scale integrated township in the same west corridor, and the only peer in this set that also runs a hotel-plus-MICE business — the segment CBDK operates alongside its real estate through its convention and exhibition assets.
Lippo Karawaci's explicit statement of who it competes with and on what axes — other large developers, judged on location, supporting infrastructure, services and price — plus the strengths it claims in response.
The broad segmentation of the national property industry is influenced by various factors, including the growing and expanding presence of smaller regional competitors. Meanwhile, the Company’s competitors primarily consist of other major property developers, especially in terms of development locations, supporting facilities and infrastructure, available services, and pricing. Despite intensifying competition, the Company remains committed to strengthening its competitiveness by leveraging its core strengths in the Real Estate Development business in Indonesia, including its extensive land bank, well-established infrastructure, innovative products, strong reputation, proven track record, experience, and competitive financing options.
p. 118 · Read in context →
Lippo Karawaci's industry review describes a contraction in MICE demand driven by government budget tightening, alongside falling star-hotel occupancy — the demand pool CBDK's convention, exhibition and hotel segment draws on.
The national hospitality industry faced significant challenges and volatility throughout 2025. Overall, sector revenue declined, with a number of hotels reporting year-on-year decreases in both occupancy and income. As of February 2025, the average occupancy rate of star-rated hotels fell to 47.21%, compared with 49.45% in the same period of the previous year. […] This downward trend is further compounded by a contraction in demand for MICE (Meeting, Incentive, Convention, Exhibition) services, particularly from the government sector, which implemented budget tightening for business travel and events. At the same time, hotels are experiencing margin pressure due to rising costs—namely labor and utilities—combined with subdued demand.
p. 98 · Read in context →
The scale of a mature Tangerang township after three decades — unit count, resident population and the facility stack — set against group pre-sales that fell to Rp5.32tn in 2025 from Rp6.01tn.
As of 2025, Lippo Village comprises 14,765 property units developed in accordance with the LV Building Code & Control and is home to 69,447 residents. This integrated township is further supported by comprehensive facilities that address residents’ daily needs across health, recreation, and worship. These include 1,430 shop houses, 2 malls, 1 university, 11 schools, 1 hospital, 5 places of worship, 3 office buildings, 1 golf course, 1 five-star hotel, and 4 culinary complexes. […] Throughout 2025, LippoLand generated pre-sales of Rp5,32 trillion, a decrease from Rp6.01 trillion in the previous year. […] LippoLand during the same period successfully sold 6,047 property units.
p. 102 · Read in context →
PT Pakuwon Jati Tbk (PWON)
Named in CBDK's prospectus and the listed benchmark for the format CBDK is building in the PIK2 CBD — superblocks combining malls, offices, hotels and condominiums, run for recurring income. Pakuwon's centre of gravity is Surabaya, so the overlap is in business model and Jakarta commercial assets rather than geography.
Pakuwon explains a jump in the share of pre-sales above Rp5bn per unit as upgraders and repeat buyers trading up inside an established superblock — the ecosystem effect a mature mixed-use estate can lean on.
The higher contribution from units above IDR 5 billion is mainly driven by upgrader and repeat buyers from the Eluna Tower launch (Kota Kasablanka phase 4). Existing customers are moving into higher-value products within the same ecosystem, reflecting strong brand loyalty and confidence in the project. This trend supports a shift toward higher-value products, reinforcing both pricing power and margin quality.
p. 25 · Read in context →
More peer documents
LPKR_annual_report_FY2024 — 296 pages · Prior-year Lippo Karawaci report with a longer 'Persaingan Usaha' section (pp.141-142) and separate MICE and market-share discussion — useful for a year-over-year read on how the same competitor describes the field. · Open →
ASRI_annual_report_FY2024 — 331 pages · Alam Sutera's FY2024 report states an explicit intent to grow market share via a wider price-range portfolio (p.111) and gives the pre-downturn Tangerang baseline against which the 2025 miss can be measured. · Open →
Q3_FY2025 — 65 pages · Ciputra's 9M25 deck — the quarter in which the FY25 target was cut — gives the intra-year sequence of the demand slowdown that the full-year deck only summarises. · Open →
Q2_FY2025 — 65 pages · Ciputra's 6M25 deck carries the same country-overview pack (mortgage penetration, RPPI, urbanisation) at an earlier date, useful for checking how stable those market-sizing slides are quarter to quarter. · Open →
Q4_FY2025 — 41 pages · Pakuwon's full-year 2025 deck with the FY presales mix, mall occupancy by asset and the land-bank table at 521.7 ha — the annual counterpart to the 1Q26 figures used above. · Open →
Q2_FY2025 — 44 pages · Mid-2025 Pakuwon deck covering the Bekasi and Batam expansions and the retail portfolio, for tracking how a recurring-income operator paces new superblock capital commitments. · Open →
Q1_FY2026 — 67 pages · Beyond the exhibits used, pp.36-45 detail Ciputra's 2026 project launches including AeroWorld 8, an 'Airport Central Business District and Living' scheme mapped adjacent to Pantai Indah Kapuk. · Open →
Bottom line
CBDK sells serviced land inside one 700-hectare estate west of Jakarta, collects the money up front, and books it as revenue years later on handover. That mechanism produced Rp1,364 billion of FY2025 profit to shareholders on a 66% gross margin. It also means FY2025 order intake of Rp430 billion — down 80% year on year in the company's own operational table — has not yet touched reported earnings.
One estate, one controlling owner
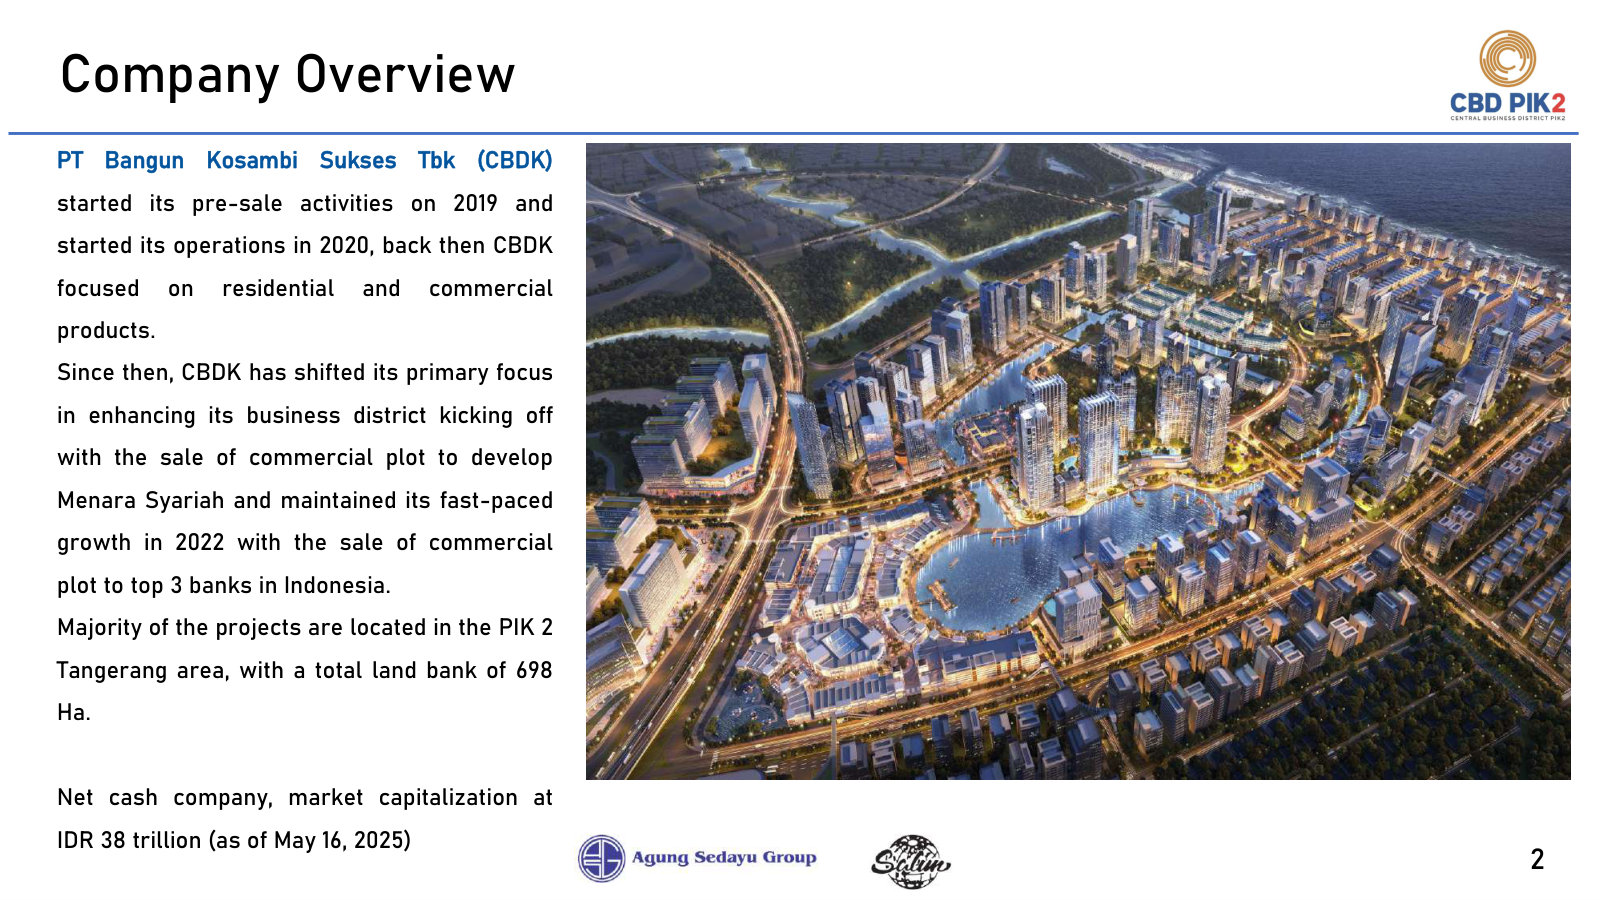
PT Bangun Kosambi Sukses Tbk develops the central business district of PIK 2, a coastal township in Tangerang, Banten, roughly 25 km west of central Jakarta. Its inventory is not a portfolio of projects across a country; it is 702 hectares of land reserves in one place, sold plot by plot and building by building across 16 products at the end of 2025 [1]. Control is concentrated to an unusual degree. PT Pantai Indah Kapuk Dua Tbk (PANI) held 87.27% of the shares at the end of 2025, up from 51.00% a year earlier as the two founding vehicles — PT Agung Sedayu and PT Tunas Mekar Jaya — folded their stakes into the listed parent and were left with 1.37% each. The public holds exactly 10.00%, the IDX minimum. No director or commissioner owns shares directly; the annual report names President Commissioner Richard Halim Kusuma as the ultimate beneficial owner [2].
The company listed on 13 January 2025 at Rp4,060 per share, with 5,668,944,500 shares outstanding and a market capitalisation of Rp23,016 billion on the day [3]. Three days later it spent IPO proceeds acquiring 99.90% of PT Industri Pameran Nusantara, operator of the NICE convention centre, and in March 2025 added PT Citra Kirana Bisnis Distrik, developer of the Hilton PIK2 hotel due to open in 2027 [4].
Market cap (Rp bn, 23 Jul 2026)
FY2025 revenue (Rp bn)
FY2025 profit to parent (Rp bn)
Net cash, 31 Dec 2025 (Rp bn)
Sources: market cap derived from 5,668,944,500 shares [5] at the Rp3,760 close of 23 July 2026 (market data, as reported); revenue and profit from the FY2025 Financial Highlights [6]; net cash derived from cash of Rp3,121.0 bn [7] less bank loans of Rp249.5 bn [8].
Cash first, revenue years later
The accounting mechanism matters more here than at most developers, and the company states it plainly: because most sales are made on an indent (pre-order) basis, CBDK recognises almost no trade receivables. Money received before the performance obligation is fulfilled sits on the liability side as advances from customers, and becomes revenue only when control of the unit or plot passes to the buyer [9].
That pool is the largest single item on the balance sheet after land. Advances from customers stood at Rp9,547 billion at 31 December 2025 (Rp8,411 bn current plus Rp1,136 bn non-current), against Rp9,937 billion a year earlier and Rp8,699 billion at 1 January 2024 [10]. It is 42% of the Rp22,576 billion balance sheet and nearly four times FY2025 revenue.
Sources: advances from customers at 1 Jan 2024, 31 Dec 2024 and 31 Dec 2025 [11]; net revenues from the FY2025 Financial Highlights [12].
Two features of that chart carry the business model. First, the pool is very large relative to the income statement, so reported revenue in any year is mostly a release of cash collected in earlier years rather than a measure of current selling. Second, 2025 is the first year the pool shrank — by Rp390 billion — meaning recognition ran ahead of fresh collections for the first time in the reported record.
The land behind it is carried at the lower of cost and net realisable value. Inventories totalled Rp13,820 billion at end-2025 (Rp6,910 bn current, Rp6,911 bn non-current) [13], 61% of assets, spread across the 702-hectare reserve [14]. Land carried at historic cost and sold at central-business-district pricing produces the margin: cost of revenues was Rp850 billion against Rp2,504 billion of sales in FY2025 [15].
Three years of reported numbers
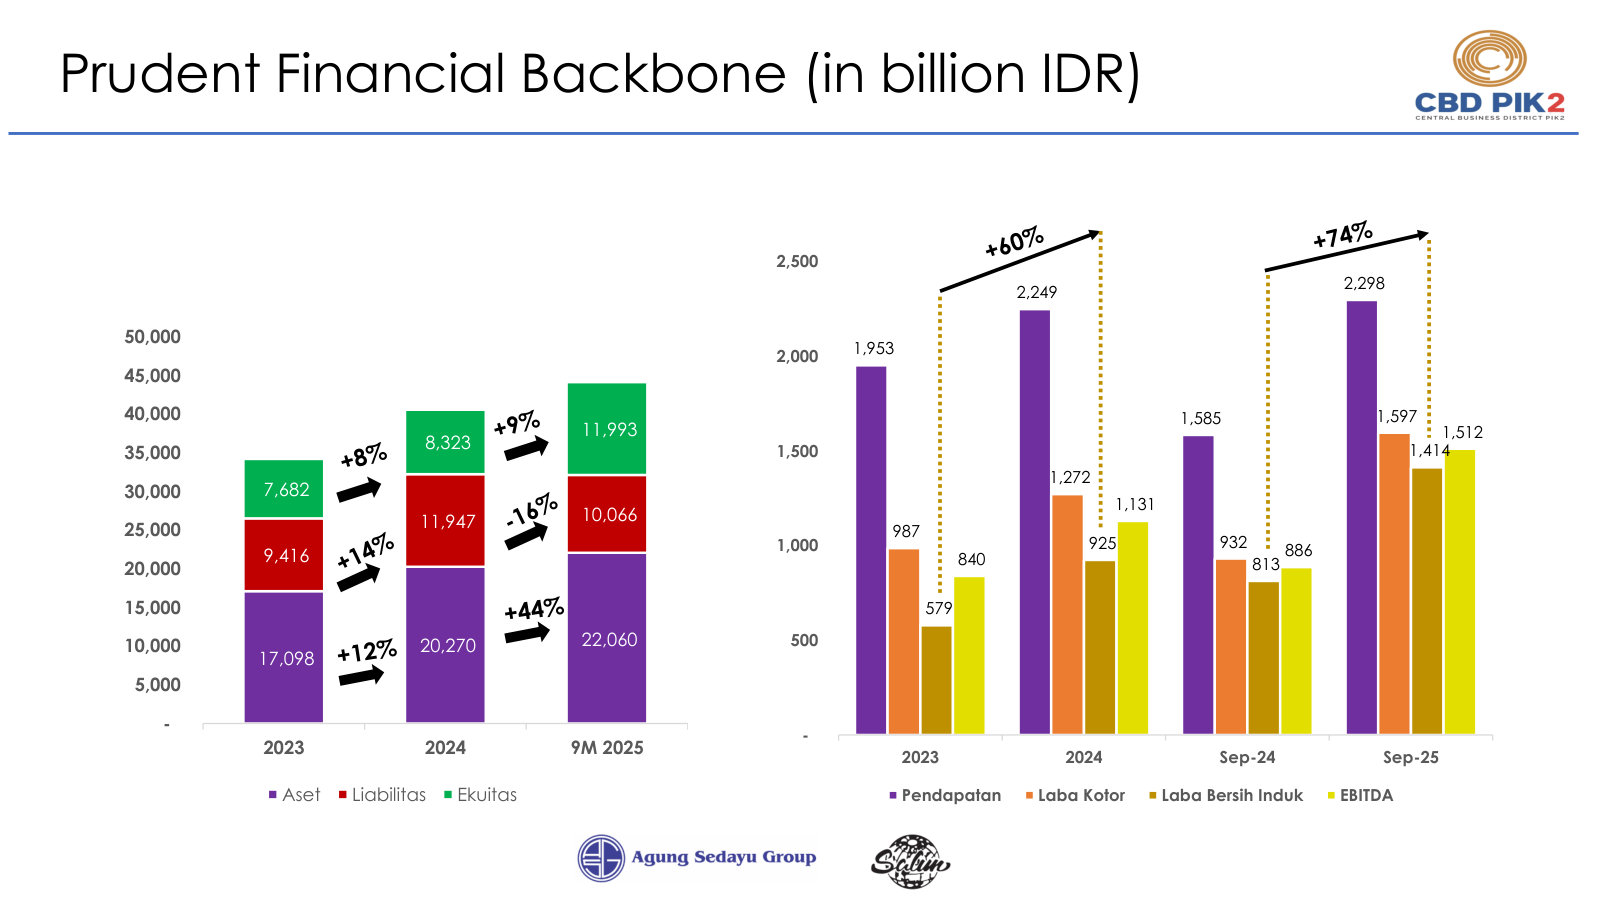
On the reported line, the trajectory is uninterrupted improvement. Revenue rose from Rp1,953 billion in 2023 to Rp2,504 billion in 2025; gross margin widened from 50.5% to 66.1%; profit attributable to owners of the parent more than doubled, from Rp579 billion to Rp1,364 billion; earnings per share went from Rp113.40 to Rp241.45 [16] [17].
Source: FY2025 Annual Report, Financial Highlights and Financial Ratios [18] [19].
The first quarter of 2026 extended the pattern sharply. Net revenue of Rp743 billion was 74% above the Rp426 billion of Q1 2025, and gross profit of Rp616 billion implies an 82.9% gross margin [20]. Profit attributable to owners of the parent was Rp541 billion against Rp130 billion a year earlier [21].
Two details inside that quarter are worth carrying forward. The real-estate segment earned Rp650 billion of gross profit on Rp737 billion of revenue — an 88% margin — while the convention and exhibition segment, the recurring-income pivot management describes, produced Rp5.8 billion of revenue against Rp39.9 billion of cost, a gross loss of Rp34 billion [22]. And two buyers accounted for Rp518 billion, or 70% of quarterly revenue: PT Global Jet Express at Rp269 billion and PT Erajaya Swasembada Tbk at Rp249 billion, against nil in the comparative quarter [23]. For FY2025 as a whole, the audited note states no single customer exceeded 10% of consolidated revenue [24]. Quarterly earnings at this company are lumpy because a single corporate land purchase can be most of a quarter.
Order intake fell while profit rose
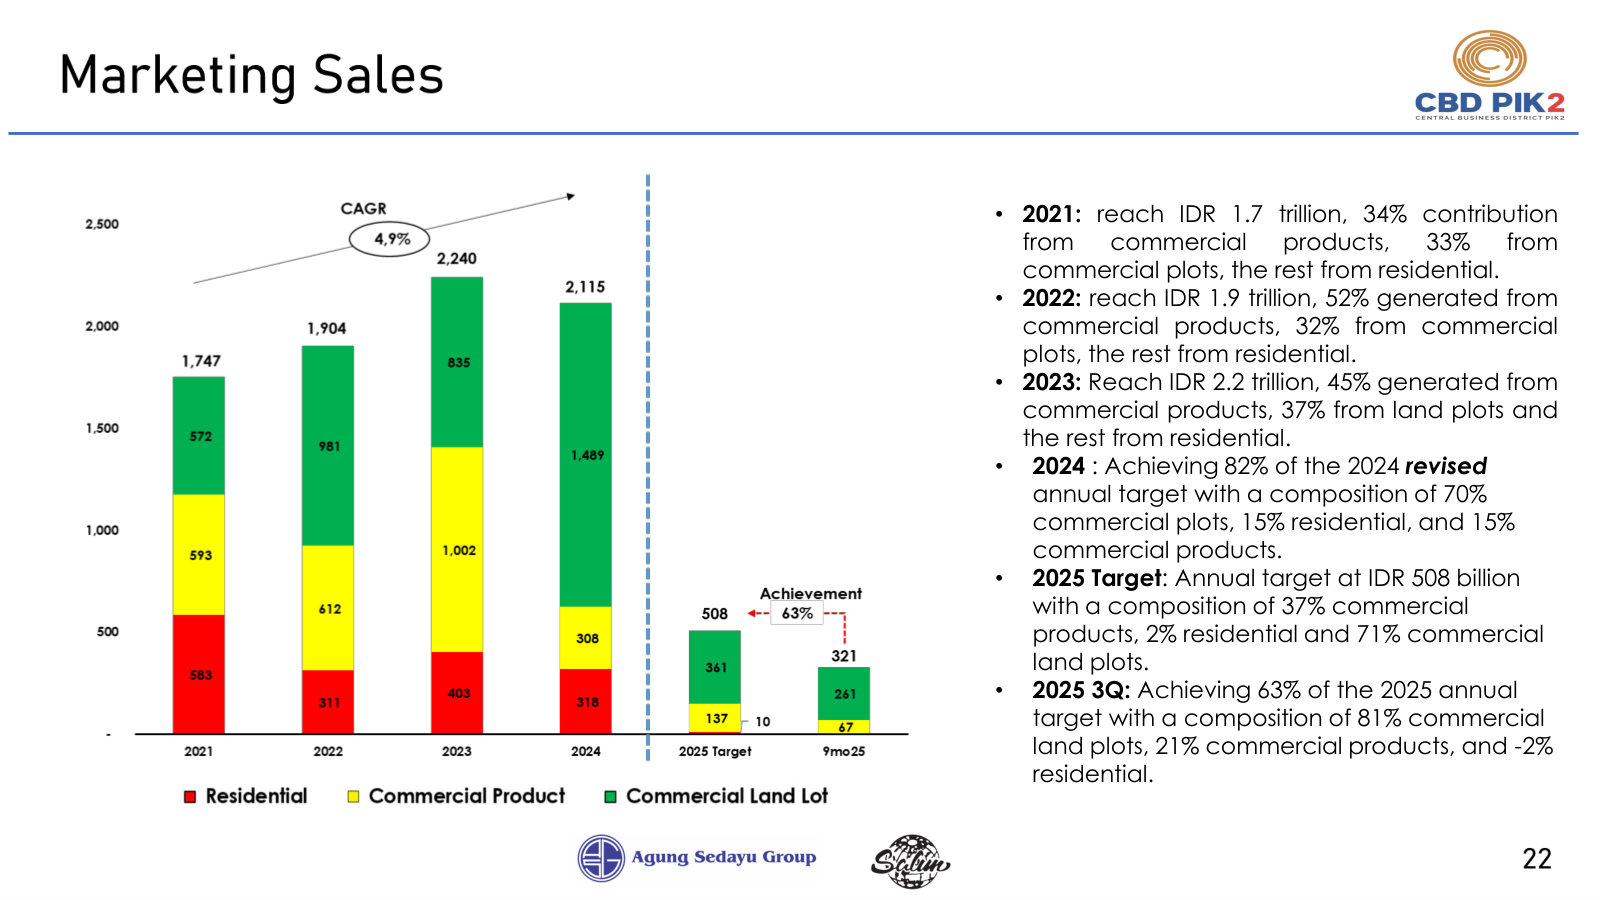
The forward-looking series moves the other way. The FY2025 annual report's operational highlights table, stated consistently in Rp million across three years, shows total marketing sales of Rp2,240 billion in 2023, Rp2,115 billion in 2024 and Rp430 billion in 2025 — a 79.7% decline in the latest year. Commercial land plots, the largest line, fell from Rp1,489 billion to Rp344 billion; commercial products from Rp308 billion to Rp83 billion; residential from Rp318 billion to Rp3.7 billion [25].
Sources: marketing sales by segment, FY2025 Operational Highlights [26]; net revenues, FY2025 Financial Highlights [27].
The company's own target moved with it, and the two annual reports do not reconcile. Writing in the FY2024 report, management set a 2025 pre-sales target of Rp2.03 trillion, to be supported by four subsidiaries [28]. The FY2025 report presents the 2025 target as Rp508 billion and the outcome as Rp430 billion, or 84.67% of target [29]. Neither report reconciles the roughly 75% reduction between the two filings: the FY2025 report describes its Rp508 billion target as "a conservative yet realistic approach to maintain growth sustainability amid global economic uncertainty", without reference to the Rp2.03 trillion published a year earlier [30]. The 2026 target is Rp563 billion, 30.9% above the 2025 outcome and around a quarter of what 2024 actually delivered [31].
The strongest fact against reading this as demand failure is the FY2024 base itself. The FY2024 report describes 2024 pre-sales of Rp2.12 trillion, of which Rp1.49 trillion was commercial land plots, up 78% from Rp835 billion in 2023 [32]. A book of that size, sold indent and recognised on handover, funds several years of revenue on its own — which is precisely what the Rp9.5 trillion advances pool represents. Weak intake in 2025 therefore does not have to show up in 2026 or 2027 earnings, and Q1 2026 shows it has not. What it does is set the pace at which the pool empties.
What the shares have done
The reception at listing was enthusiastic and did not last. The shares opened at Rp4,060, touched Rp11,450 within the first quarter — 2.8 times the offer price — and closed 2025 at Rp8,750, valuing the company at Rp49,603 billion [33]. They then fell through 2026 to Rp3,760 on 23 July, roughly 57% below the 2025 close and 7% below the Rp23,016 billion capitalisation at which the company listed [34]. Reported earnings accelerated the whole way down.
Sources: IPO price and 2025 quarterly closes, FY2025 Share Highlights and Corporate Actions [35] [36]; 2026 quarter-end and latest closes from market data, as reported.
At Rp3,760 the arithmetic is compact. Market capitalisation is Rp21,315 billion. Trailing twelve-month profit to the parent — FY2025 less Q1 2025 plus Q1 2026 — is Rp1,776 billion, or Rp313 per share, putting the shares on about 12 times trailing earnings. Equity attributable to owners of the parent was Rp9,026 billion at end-2025 [37], so the market pays roughly 2.4 times book — book that carries the land at historic cost. Net cash of Rp2,872 billion is 13% of the market value. The dividend distributed in 2025 was Rp5 per share, Rp28.34 billion in total, or 3.06% of FY2024 profit [38].
Interest-bearing bank debt was Rp249.5 billion at end-2025 against Rp3,121 billion of cash [39] [40]. The largest claim ranking ahead of shareholders is the Rp9.5 trillion owed to buyers in undelivered units and plots.
What this report examines
This report examines whether CBDK's reported profits — released from a Rp9.5 trillion pool of customer money collected in earlier years against land carried at historic cost — can be replenished by new sales at anything like the rate they are being consumed, and what price that answer supports after the shares gave back everything they gained since listing.
The evidence so far points both ways, and honestly so. In favour of the business: 66% gross margins in FY2025 rising to 83% in Q1 2026, net cash, minimal debt, a land position in one of the few large master-planned districts within reach of Jakarta, and a controlling owner with the balance sheet to keep building. Against it: order intake down 80% in a year, a 2025 target cut roughly 75% between two consecutive annual reports without explanation, a 10% free float, a convention business currently loss-making at the gross line, and 70% of the most recent quarter's revenue from two corporate buyers.
What would settle it is observable and dated. If marketing sales in 2026 land near the Rp563 billion target while the advances pool keeps falling, the pool is being drawn down rather than refilled, and the current earnings run-rate is temporary. If intake instead returns toward the Rp2 trillion range that 2023 and 2024 delivered, the 2025 figure was a pause. The 2026 full-year operational highlights table, published in the FY2026 annual report and previewed in quarterly disclosure, is where that reads out.
Every figure above comes from CBDK's own filings and from market price data. Nothing here rests on press coverage, broker estimates, or the regulatory debate around the PIK 2 area.
Bottom line
CBDK's cash flow statement crossed over in 2025. Cash received from customers fell to Rp2,326 billion from Rp3,274 billion while recognised revenue rose to Rp2,504 billion [1] — the first year the company booked more revenue than it collected [2]. In the March 2026 quarter the gap widened and operating cash flow turned negative, at minus Rp131 billion against Rp546 billion of reported profit [3].
Cash in, revenue out
The reported profit and loss account for 2023 to 2025 is a clean upward line, and the orientation chapter sets it out. The cash flow statement tells a different story, and it is the more informative of the two for a business that collects money years before it recognises revenue.
Because CBDK sells on an indent basis, the cash flow line "receipt from customers" is close to a direct measure of commercial activity in the period: it is money physically arriving from buyers, whether against a plot sold last month or an instalment on one sold three years ago. Recognised revenue, by contrast, is the release of earlier collections onto the income statement when a unit is handed over. The difference between the two is the direction the advances pool is travelling.
Sources: FY2025 receipts and the FY2024 restated comparative from the FY2025 consolidated cash flow statement [4]; FY2023 receipts from the audited FY2023 statements [5]; revenue from the FY2025 Financial Highlights [6].
In 2023 the company took in Rp1,146 billion more from customers than it recognised. In 2024, Rp1,025 billion more. In 2025 the sign flipped: Rp178 billion less [7] [8] [9]. The balance sheet agrees: advances from customers fell to Rp9,547 billion at end-2025 from Rp9,937 billion a year earlier [10].
The March 2026 quarter extends the trend rather than breaking it. Revenue of Rp743 billion was 74% higher year on year and gross profit rose 159% [11], and profit attributable to shareholders rose to Rp541 billion from Rp130 billion, an EPS of Rp95.58 against Rp22.92 [12]. Cash received from customers in the same three months was Rp279 billion, down from Rp815 billion a year earlier [13]. The Rp464 billion shortfall against recognised revenue is almost exactly the Rp465 billion by which the advances pool shrank in the quarter, to Rp9,082 billion [14]. The two statements are describing the same event from opposite sides.
Profit converted to cash
Source: derived from operating cash flow of Rp966.8 bn, Rp1,730.3 bn and Rp719.4 bn and profit for the year of Rp804.5 bn, Rp1,095.6 bn and Rp1,467.3 bn, FY2023–FY2025 [15] [16], and from Q1 2026 operating cash flow of minus Rp130.9 bn against profit of Rp546.2 bn [17] [18].
For two years operating cash flow ran ahead of accounting profit — 120% of it in 2023, 158% in 2024. In 2025 it covered 49%. In the March 2026 quarter it covered none of it [19] [20]. That pattern is what a pre-collected order book looks like when it is being drawn down faster than it is being refilled; it is not, on this evidence, a receivables or a working-capital problem, since CBDK carries almost no trade receivables at all [21].
Sources: FY2024 and FY2025 from the consolidated cash flow statement [22] and the three-year summary [23]; FY2023 from the audited FY2023 statements [24]; Q1 2026 from the interim statements [25].
One comparability note the table cannot show. The FY2024 column was restated during 2025 when CBDK acquired PT Industri Pameran Nusantara from an entity under common control and applied pooling-of-interests accounting, which the auditor flagged in an emphasis-of-matter paragraph [26]. The restatement added Rp1,188 billion to end-2024 total assets, matched almost exactly by additional liabilities of Rp1,194 billion, and left revenue and earnings per share unchanged [27]. The FY2023 column was not restated — the visible tell is that closing cash for 2023 is Rp288 billion while opening cash for 2024 is Rp294 billion, the Rp6 billion difference being the acquired entity's cash [28].
Management's explanation
The FY2025 management discussion attributes the 58.43% fall in operating cash flow to one cause: an increase in payments to suppliers of Rp228.92 billion, or 17.59% [29]. That figure is accurate and it is the right sign, but it accounts for roughly a fifth of the decline. Cash generated from operations before interest and tax fell Rp1,192 billion, from Rp1,819 billion to Rp627 billion, and Rp948 billion of that — four-fifths — came from the drop in receipts from customers, which the cash flow discussion does not mention [30] [31]. The larger of the two drivers is in the cash flow statement but not in management's discussion of it.
Where the money went
Cash fell Rp358 billion during 2025 even after Rp2.30 trillion of IPO proceeds arrived, because Rp2,115 billion went out through investing [32] [33]. Against the property spend, 2025 was the first year of negative free cash flow in the record: Rp719.4 billion of operating cash flow, less Rp1,147.5 billion of investment-property purchases and Rp163.9 billion of fixed assets (Rp1,311.4 billion of capital spending in total), is minus Rp592.0 billion. The March quarter added another minus Rp257 billion on the same basis [34] [35].
Most of that spending is the MICE and hospitality build-out: investment property additions of Rp1,720 billion in 2025, with the entire Rp2,586 billion of assets under construction transferred into completed buildings during the year, taking net investment property to Rp2,562 billion [36].
The whole of CBDK's Rp2,295,606,434 thousand of net IPO proceeds was applied to a single subscription for new shares in PT Industri Pameran Nusantara, whose NICE building is carried at Rp2,588,619,247 thousand and has produced Rp45,208,947 thousand of revenue — 1.75% of its cost — across its entire operating life to date at a cumulative gross loss of Rp41,074,736 thousand, while on 21 October 2025 the group placed a further Rp850,000 million of cash into Danantara Patriot Bonds maturing in 2030 and 2032 at 2% per annum against its own bank borrowing cost of 6.50% to 9.00%. [37] [38] [39] [40] [41]
The notes describe that placement as two equal tranches of long-term bonds issued by PT Danantara Investment Management (Persero), "Patriot Bond" Series A and Series B, carrying interest of 2% per annum and maturing in October 2030 and October 2032 [42]. That is 37% of net IPO proceeds committed for five and seven years at 2%, by a company whose own bank facilities cost between 6.50% and 9.00% [43]. The bonds are carried at amortised cost equal to nominal value, and the fair-value note states that the fair value of the Group's financial assets approximates carrying value "as the effect of discounting is not material" — a statement that now covers a five-to-seven-year instrument yielding a third of what the company pays its own banks [44] [45]. Discounted at 6.5% — the lowest rate CBDK itself pays, and so the most generous assumption available from its own filings — the two tranches are worth in the region of Rp665 billion rather than Rp850 billion. That is my arithmetic, not a company disclosure; the filings offer no separate valuation of the instrument.
A second use of cash sits in current assets. Prepaid taxes reached Rp1,013 billion at end-2025, from Rp864 billion and Rp712 billion in the two prior years, of which Rp773 billion is unrecovered value-added tax [46]. At 31 March 2026 the balance was Rp1,020 billion [47]. That is cash already paid to the tax authority, equal to 69% of FY2025 group profit, sitting on the balance sheet pending refund or offset, and it has grown every year in the record.
Whose profit it is
Group profit and profit attributable to shareholders have moved at different speeds, and the gap is not small. Between 2023 and 2025 profit for the year rose Rp662 billion, from Rp805 billion to Rp1,467 billion. Profit attributable to owners of the parent rose Rp786 billion, from Rp579 billion to Rp1,364 billion, because the parent's share of group profit went from 71.9% to 93.0% as non-controlling interests fell from Rp226 billion to Rp103 billion [48]. Held at the 2023 share, FY2025 profit to shareholders would have been about Rp1,055 billion. On that arithmetic roughly Rp309 billion — 39% of the two-year increase in shareholder profit, and Rp55 of the Rp128 increase in EPS — came from owning more of the same group rather than from the group earning more. What CBDK paid the sellers, and to whom, is a separate question the filings answer only in part; the related-party record is set out in Ownership and Affiliates.
What "net cash" does and does not cover
For a reader whose first screen is solvency, the headline numbers are reassuring and mostly earned. Borrowings were Rp249 billion at end-2025 against Rp3,121 billion of cash, so net cash of Rp2,872 billion and a gearing ratio the company reports as nil [49]. Interest cover is 50 times, and management states plainly that as of end-2025 no financial-ratio covenants applied under any of its loan agreements [50]. At 31 March 2026, cash of Rp2,745 billion against borrowings of Rp234 billion leaves Rp2,512 billion of net cash, and equity attributable to shareholders of Rp9,506 billion [51] [52]. There is no maturity wall here and no lender who can force the issue.
Two qualifications belong next to those numbers. First, the ratio the performance highlights label "Liabilities to Equity" is 0.02, which is borrowings over equity; total liabilities of Rp10,594 billion against equity of Rp11,982 billion is 0.88 [53] [54]. Second, Rp8,411 billion of the Rp9,547 billion advances balance was classified current at end-2025, against Rp7,648 billion a year earlier, while the non-current portion halved to Rp1,136 billion [55]. The company is telling the reader it expects to hand over, and therefore build and deliver, substantially more within twelve months. The current ratio of 1.20 and quick ratio of 0.45 are calculated against that reclassified obligation [56]. What ranks ahead of shareholders here is an obligation to build and hand over units to buyers.
The company has also started buying its own shares. Between 3 February and 31 March 2026 it repurchased 11,257,600 shares for Rp61.3 billion — an average of about Rp5,444 a share, against the Rp3,760 close on 23 July 2026 — using the OJK provision that permits buybacks without a shareholder meeting in significantly fluctuating market conditions [57].
The forward view is one analyst deep
There is effectively no consensus to lean on. One analyst submits estimates: FY2026 EPS of Rp226 and revenue of Rp2,812 billion, against FY2025 reported EPS of Rp241.45. One independent data provider states outright that coverage is insufficient to forecast growth and two others carry no price target or consensus at all, and the aggregated twelve-month target of Rp13,700 is a single unrevised number that has not moved with a share price that has more than halved [58].
Sources: estimates, target price and broker range from the consensus summary [59]; FY2025 EPS [60]; Q1 2026 EPS annualised from Rp95.58 for the quarter [61]; company target from the FY2025 marketing sales plan [62]; share price from market data as reported.
The spread inside that table is the useful part. The single aggregated estimate implies FY2026 EPS slightly below FY2025, which puts the shares on about 16.6 times forward earnings at Rp3,760; the March quarter alone, annualised, implies Rp382 and about 9.8 times. Named local brokers sit between Rp3,500 and Rp13,100 — a range of nearly four times on the same company [63]. The company's own forward commitment is not an earnings number at all: a 2026 marketing sales target of Rp563 billion [64]. Because revenue is released from a pool collected earlier, reported earnings and current order intake can diverge for years, which is precisely why the two forward anchors available point in different directions.
How this reads
On the evidence above, the earnings acceleration through 2025 and into 2026 is being funded out of the balance sheet rather than out of current trading. That is a legitimate way to run an indent-sale developer and it is fully disclosed in the primary statements; it is not a fraud pattern, and there is no lender in a position to force anything. What it does mean is that the profit line and the cash line have separated, and the gap between them is being met out of the advances pool.
The strongest fact against reading it as deterioration is timing. Handovers are lumpy, a single quarter's collections say little, and the pool at 31 March 2026 was still Rp9,082 billion — more than three years of FY2025 revenue [65]. A single large collection in a later quarter would flip the sign back. The reclassification of Rp1.15 trillion of advances from non-current to current also suggests management expects a heavy delivery year, which mechanically front-loads recognition without implying weak demand.
Two observations would change the read. Receipts from customers recovering above recognised revenue for two consecutive quarters would say the crossover was a delivery-schedule artefact. Receipts staying near the Q1 2026 level through the half-year statements, due at the end of July 2026 [66], would put the drawdown on a footing where the pool, not the market, is setting the pace of reported earnings — and the company's own Rp563 billion order-intake target would then be the binding constraint rather than a formality.
Ownership and Affiliates
The public owns exactly 10.00% of CBDK; the Kusuma and Halim families control the rest through a four-layer chain ending at PT Pantai Indah Kapuk Dua. No director or commissioner owns a share directly, there is no option or share plan, and the entire board cost Rp2.7 billion in 2025 — billed through the parent. In the same year the company signed nine affiliated transactions worth Rp7,472 billion and reported no conflict of interest in any of them.
2025 Board Pay (Rp bn)
2025 Affiliated Deals Signed (Rp bn)
Book Value Moved from Minorities (Rp bn)
Sources: FY2025 Annual Report, Nomination and Remuneration Policy [1]; Material Information on Investment, Expansion, Divestment, Merger and Acquisition, pp.128-143, beginning with the Company's acquisition of PT IPN under the Conditional Share Subscription Agreement [2]; Note 16 Non-Controlling Interests, difference from changes in equity of subsidiaries [3].
The control chain
CBDK sits four layers below the people who control it. PT Pantai Indah Kapuk Dua Tbk (PANI) holds 87.27%, with PT Agung Sedayu and PT Tunas Mekar Jaya each holding a further 1.37% directly and the public exactly 10.00% [4]. PANI is 84.09% owned by PT Multi Artha Pratama, which in turn is split between PT Agung Sedayu and PT Tunas Mekar Jaya; PT Agung Sedayu is held 50/50 by PT Cahaya Bintang and PT Catur Kusuma Abadi Sejahtera, and PT Catur Kusuma is held in four equal quarters by Sugianto Kusuma, Richard Halim Kusuma, Alexander Halim Kusuma and Luvena Katherine Halim [5] [6]. PT Tunas Mekar Jaya is 99.9995% owned by Hindarto Budiono [7].
Sources: FY2025 Annual Report, Shareholders Structure and Composition, pp.86-87 — PT Pantai Indah Kapuk Dua Tbk at 87.27% [8] and the ownership diagram through PT Multi Artha Pratama [9]; IPO Prospectus: PT Agung Sedayu's 50/50 holders, p.170 [10]; Hindarto Budiono's stake in PT Tunas Mekar Jaya, p.172 [11].
Multiplying the chain through, PANI's 87.27% and the two direct 1.37% blocks give the Agung Sedayu / Tunas Mekar Jaya side a look-through economic interest of roughly 76% of CBDK — 84.09% of 87.27%, plus the 2.74% held directly. The remaining 13.9 percentage points of PANI's stake belong to PANI's own minority holders. For a reader who values owner-operators, the alignment is real and large. It is also entirely indirect: the annual report states plainly that as at the end of 2025 no member of the Board of Commissioners or the Board of Directors owned any shares in the company, and that Richard Halim Kusuma, the President Commissioner, is recorded as the ultimate beneficial owner through the chain above [12]. There is no employee or management share plan of any kind [13].
The board's own affiliation table names three of the ten officers as related to the controlling shareholders: Richard Halim Kusuma (President Commissioner), Steven Kusumo (President Director) and Linda Kusumo (Director) each carry a family and a management relationship with the major shareholder [14]. One of the three commissioners is independent.
What the board is paid
Total remuneration for all three commissioners and seven directors was Rp2,674 million in 2025 — 0.20% of the Rp1,364,252 million of profit attributable to CBDK's owners [15] [16]. The audited note carries the same figure and classifies all of it as short-term employee benefits [17]. The March 2026 quarter ran at Rp873 million, against Rp656 million a year earlier [18].
Two qualifications matter more than the number. First, the remuneration is paid through the parent entity as a related party — it is a recharge from PANI, not a payroll line CBDK controls, and the company states that it does not disclose individual amounts [19]. Second, for 2024 and 2023 no amount was disclosed at all: the note says only that salary and other allowances for commissioners and directors were paid by a related party [20]. A CBDK shareholder can see what the group chose to recharge, not what these people earn across the group.
Sources: CBDK FY2025 Annual Report, board remuneration p.185 [21] and profit attributable to owners of the parent p.356 [22]; PT Alam Sutera Realty FY2025 Annual Report, total remuneration p.252 [23]; PT Bumi Serpong Damai FY2025 Annual Report, salaries and other short-term employee benefits p.469 [24]; PT Lippo Karawaci FY2025 Annual Report p.194, where the Dewan Komisaris total of Rp5,399,082,438 and the Direksi total of Rp75,306,600,093 are disclosed separately [25]. Peer profit attributable to owners: ASRI p.246 [26], BSDE, profit attributable to owners of the parent company, p.461 [27]; LPKR, profit for the year attributable to owners of the parent, p.108 [28]. LPKR's remuneration figure is from its governance section; the others are from audited related-party notes.
CBDK's board costs about one-twelfth of ASRI's while its parent-attributable profit is more than four times ASRI's. On the evidence available, executive pay is not a leakage channel at this company. What is disclosed is the recharged total for ten officers in one year; what is not disclosed is any individual amount, any split between the two boards, or anything at all for 2024 and 2023.
Nine transactions, one side of the table
Every material transaction CBDK executed in 2025 was with a party under the same ultimate control. There were nine, totalling Rp7,472 billion — a third of the Rp22,576 billion balance sheet [29] — and the annual report states that throughout 2025 the company did not conduct any material transaction containing elements of conflict of interest [30].
Source: FY2025 Annual Report, Material Information on Investment, Expansion, Divestment, Merger, Acquisition and Debt Restructuring, pp.128-143: the acquisition of PT IPN [31], the KML land lease [32], and the December MAS and CGIC subscriptions [33].
Six of the nine are capital injections into CBDK's own subsidiaries, so the cash stays inside the consolidated group. The two that move money out are the third item and, indirectly, the first. The lease is the more consequential: the land under NICE, the convention centre that anchors the whole Rp2.30 trillion MICE acquisition, is not owned by CBDK. KML — a company owned directly by PT Agung Sedayu and PT Tunas Mekar Jaya — leases it to IPN for twenty years at a rent that varies with IPN's own profit or loss [34] [35]. The note discloses only that the lease fee is a variable amount based on IPN's own financial performance; no formula, cap, floor or amount actually paid is disclosed in any period. The arrangement carries a stated transaction value of Rp1,570 billion.
Six of the nine were appraised by KJPP Kusnanto and Rekan, retained by CBDK's management [36] [37]; the two June subscriptions went to a second firm, KJPP Suwendho Rinaldy and Rekan, assigned by the same management [38]; and the March purchase of CKBD was recorded as an exempt affiliated transaction, with no fairness opinion disclosed [39]. The company's stated rationale for dealing with an affiliate rather than a third party is that it "allows the implementation process to be carried out more efficiently and with competitive pricing" than an arm's-length alternative would [40]. No competing bid or market test is disclosed for any of the nine.
The subscription ladder into MAS and CGIC
The six subscriptions are where value actually crossed between CBDK's shareholders and the family. MAS carries Rp10,461 billion of assets and booked Rp1,071 billion of revenue in 2025, against CBDK's consolidated net revenues of Rp2,504 billion [41] [42]. In each round CBDK subscribed for new shares that no other shareholder took up, so its stake rose and the non-controlling holders were diluted without being paid [43].
The audited note discloses, for every round, the cash CBDK paid and the book value of the interest it thereby acquired.
Source: FY2025 Annual Report, Note 15c Difference Arising from Changes in Equity of Subsidiaries — the August 2024 round, where the Company invested in MAS and CGIC, p.406 [44]; the March and June 2025 investments in MAS and CGIC, p.407 [45]; the December 2025 investments in MAS and CGIC, p.408 [46].
In March 2025 CBDK paid Rp308,000 million for an interest in MAS carrying Rp693,301 million of book value; in June it paid Rp317,250 million for Rp648,489 million [47]. The December round reversed the direction: Rp2,000,878 million for Rp1,919,081 million of book value at MAS, and Rp799,200 million for Rp764,376 million at CGIC — both roughly 4% above book [48]. Netting the six rounds, Rp845,352 million of book value moved out of non-controlling interests and into equity attributable to CBDK's owners during 2025 — the figure appears on both sides of the audited statements, as a credit inside additional paid-in capital and as the largest debit in the non-controlling interests roll-forward, which ends the year at Rp2,956,131 million against Rp3,773,220 million at the start [49]. Against parent equity of Rp9,026,319 million at year end [50], that is 9.4%.
The same dilution moved earnings. MAS produced Rp360,199 million of total comprehensive income in 2025, of which non-controlling interests were allocated Rp114,445 million — an implied weighted-average outside stake of 31.8%, between the 44.11% they held in January and the 22.65% they held in December [51]. Had the January stake held all year, outside holders would have taken about Rp158,900 million rather than Rp114,445 million; at the December stake they would take about Rp81,600 million. On MAS's 2025 result, the ladder is worth roughly Rp44 billion of parent profit in 2025 and about Rp77 billion a year once annualised. Total non-controlling profit across the group fell from Rp170,850 million to Rp103,097 million between 2024 and 2025 while group profit rose [52].
This ladder runs in the public shareholder's favour. The longer history does not. CBDK bought its original 51% of MAS and CGIC from the same family in August 2022 for Rp4,699,823 million and Rp1,799,578 million against book values of Rp2,365,177 million and Rp942,654 million [53]. Because these were common-control transactions, no goodwill was recognised; the Rp3,191,570 million excess was charged straight to equity, and the January 2025 IPN purchase added a further Rp6,536 million, leaving a cumulative Rp3,198,105 million debit inside additional paid-in capital [54]. Set the Rp1,127,988 million of cumulative subscription credits against it and the group's dealings with itself have left a net Rp2,070,117 million debit balance in CBDK's paid-in capital — 23% of parent equity. The 2022 premium was paid before the January 2025 listing, so it was borne by the family rather than by the public; what the public inherited is the depleted equity account, not the loss.
The affiliate as customer, landlord and banker
Related parties also appear on the revenue line. Sales to entities under common control were Rp152,427 million in 2023 (7.80% of revenue) and Rp373,358 million in 2024 (16.60%) — PT Sedayu Sejahtera Abadi and PT Citra Abadi Mandiri — then nil in 2025 [55] [56].
Sources: FY2024 Annual Report, Note 26 p.259, sales to PT Sedayu Sejahtera Abadi and PT Citra Abadi Mandiri [57]; FY2025 Annual Report, Note 21 p.415, where PT Sedayu Sejahtera Abadi and PT Citra Abadi Mandiri fall to nil [58].
The indent model that produces CBDK's cash-up-front economics leaves it with essentially no trade receivables from ordinary buyers — Rp81 million from third parties at the end of 2024, Rp1,800 million at the end of 2025 [59]. The one exception in the record is the affiliate business: at 31 December 2024, on the balance sheet CBDK carried into its listing, the only trade receivable of consequence was Rp213,393 million owed by two sister companies, Rp212,985 million of it by PT Sedayu Sejahtera Abadi [60] against the Rp222,575 million of revenue booked to it that year [61]. It was cleared during 2025.
Affiliates sit on the other side of the advances pool too. Of the Rp9,547 billion of advances from customers, current and non-current, at the end of 2025 [62], Rp570,023 million came from related parties — Rp538,363 million of it from PT Citra Abadi Mandiri, a figure that has barely moved since 2023 [63] and stood at Rp551,876 million at 31 March 2026 [64] [65]. Roughly 6% of the pool from which reported profit is released was placed there by a company under common control.
Rp503,425 million of the group's cash sat at PT Bank Artha Graha Internasional and PT Bank Ina Perdana at the end of 2025 — including a Rp390,000 million time deposit at Artha Graha, up from Rp10,000 million a year earlier — while CBDK simultaneously owed Artha Graha Rp107,705 million [66], accounting for 41.9% of the group's finance costs [67] [68]. PANI charges a management fee for strategy, finance, marketing, human capital and accounting on an actual-cost-plus-10% basis, capped at Rp390,000 million a year and auto-renewing after 31 December 2026; the 2025 charge was Rp31,506 million, about a twelfth of the cap [69] [70].
Affiliates also lend to one another at no interest. The prospectus lists facilities under which CBDK may lend up to Rp900,000 million to KML and Rp400,000 million to PT Kemilau Karya Utama, MAS may lend up to Rp950,000 million to PT Cakra Karya Semesta, and KML and PT Bumindo Mekar Wibawa may lend up to Rp2,000,000 million and Rp800,000 million to MAS — every one at 0% interest, none with a maturity date [71]. These facilities are how the pre-IPO balance sheet was assembled and partly unwound. During 2024 CBDK collected Rp2,398,182 million of receivables from related parties, advanced Rp1,365,763 million back out, and drew Rp1,029,922 million of interest-free affiliate borrowing — together about two-thirds of the Rp3,184,719 million by which cash rose that year, to the Rp3,478,681 million the company carried into its January 2025 listing [72] [73]. In 2025 Rp1,038,191 million of that affiliate borrowing was repaid, equal to 45% of the Rp2,301,592 million of IPO proceeds received in the same statement [74].
How the ledger reads
The numbers do not show management extracting cash through pay, and the family's roughly 76% look-through stake gives it every reason to want CBDK's shares to work. What the record does show is that the counterparty, the appraiser's client and the board approving the deal are the same interest, on a book where a third of the balance sheet changed hands with affiliates in a single year and no transaction in that year was classified as carrying a conflict of interest. The best evidence that the arrangement can favour minorities is the 2025 subscription ladder, which moved Rp845 billion of book value and about Rp77 billion a year of run-rate profit toward CBDK's owners. The strongest fact on the other side is that the pricing convention changed in December 2025, when the two largest rounds were struck about 4% above book rather than at a discount, and that a Rp1,570 billion twenty-year lease leaves the land under the convention centre with a family company, at a rent that varies with IPN's own profit or loss.
What would sharpen the read: disclosure of the appraiser's valuation basis for the December rounds, an individual breakdown of board pay across the group rather than only the recharged slice, and the rent actually paid under the KML lease once IPN turns a profit. Absent those, a shareholder is relying on the ledger staying as even-handed as it was in the first three quarters of 2025, on terms agreed between parties the same family controls.
Tailwinds and Peers
Indonesia's property incentives for 2025 and 2026 cover landed houses and apartments priced up to Rp5 billion. Four-fifths of CBDK's 2025 order intake was bare commercial land, and residential was 0.9% of it. The tailwind that is genuinely CBDK's is local — PIK2 infrastructure and the NICE venue — and it has not yet reached order intake.
The same year, at four other developers
In calendar 2025 Bumi Serpong Damai grew presales 3.35% to Rp10.04 trillion, Ciputra Development fell 14.1% to Rp9,461 billion and Alam Sutera Realty fell 22.8% to Rp2,439 billion, while CBDK's marketing sales fell 79.7% to Rp430 billion. [1] [2] [3] [4] [5]
BSDE order intake 2025
CTRA order intake 2025
ASRI order intake 2025
CBDK order intake 2025
Sources: year-on-year change in marketing sales — BSDE FY2025 Annual Report [6]; CTRA FY2025 results presentation [7]; ASRI FY2025 and FY2024 Annual Reports [8] [9]; CBDK FY2025 Annual Report [10].
All four report the same calendar year, in the same country, under the same incentive regime, and each publishes its intake against a target it set for itself. Bumi Serpong Damai beat the Rp10.00 trillion target it set at the start of the year [11]. Ciputra landed at 95% of a target it had already revised down [12]. Alam Sutera reached 70% of Rp3,500 billion [13]. CBDK reached 84.67% of Rp508,062 million, a target that had itself been reset during the year [14].
The national picture behind those numbers is soft, not broken. Lippo Karawaci, reading the same Bank Indonesia residential survey CBDK cites, reports that the primary-market price index grew about 1% year on year in the fourth quarter of 2025 and that primary residential sales were still contracting year on year, though at a slower pace than the quarter before [15]. A flat-to-slightly-negative market is what the peer spread of plus 3.4% to minus 22.8% describes. It does not describe an 80% fall.
Sources: CBDK FY2025 Annual Report, operational highlights and target tables [16] [17] [18]; BSDE FY2025 Annual Report [19] [20]; CTRA FY2025 and Q1 2026 results presentations [21] [22]; ASRI FY2025 and FY2024 Annual Reports [23] [24]. BSDE's 2024 intake is derived from the disclosed 3.35% growth rate; CTRA's 2025 target is the revised figure the company reported against.
The read this supports: CBDK's 2025 order-intake collapse is a company-and-product event, not the Indonesian property cycle. Three developers exposed to the same rates, the same VAT relief and the same consumer, in the same twelve months, printed changes spanning 26.1 percentage points, from plus 3.4% to minus 22.8%; CBDK sits 56.9 percentage points below the worst of them.
The strongest fact against that read is scale. In its own prospectus CBDK put itself alongside four listed competitors, none of them close to its size: total assets of Rp18,156,999 million at 30 June 2024 against Rp32,053,073 million to Rp67,862,665 million for the four [25].
Source: CBDK IPO prospectus, section 22.5 Persaingan Usaha, competitor financial data at 30 June 2024 [26].
Ciputra sold 5,065 units in 2025 across projects in Greater Jakarta, Surabaya, other Java, Sumatra and Sulawesi [27]; CBDK sells sixteen products inside one district [28]. Rp430 billion of intake is 4.5% of Ciputra's. At that scale a single large commercial land-plot transaction moves the whole year: land plots alone were Rp1,489 billion of CBDK's 2024 intake and Rp835 billion of its 2023 intake [29]. Lumpiness is a real and sufficient explanation for a large percentage swing in a small book, and the 2024 base itself included affiliate purchases that did not repeat (Ownership and Affiliates). What lumpiness does not explain is why the shortfall persisted across all three segments at once, or why the company reset its own target rather than treating the year as a timing gap (CBD PIK2 Economics).
What a sustained intake at the 2025 level costs in reported earnings power is set out in the steady-state scenario table in Backlog Run-Off, which runs CBDK's own FY2025 cost structure at fixed intake levels. Intake held at Rp430 billion supports Rp228.6 billion of profit attributable to owners, Rp40.4 of earnings per share and 93.1 times the Rp3,760 share price; the company's own Rp563 billion target for 2026 supports Rp303.5 billion, Rp53.6 and 70.1 times; intake back at the 2023–24 average of Rp2,177 billion supports Rp1,212.9 billion, Rp214.4 and 17.5 times, against FY2025 as reported of Rp1,364.3 billion, Rp241.45 and 15.6 times [30]. The horizon before intake binds is set by money already collected: the Rp9,081.7 billion of customer advances held at 31 March 2026 [31] funds roughly three years of revenue at the March-quarter rate.
The tailwinds management names
CBDK's FY2025 annual report sets out an explicitly favourable backdrop. It cites Real Estate Indonesia's projection that the property sector could grow 8% in 2026, driven by the extension of the government-borne value-added tax relief on housing to 2027, falling interest rates, and the disbursement of subsidised People's Business Credit for housing [32]. It quotes broker research describing the sector outlook into 2026 as "stellar", supported by tax incentives for middle- and lower-segment housing and lower mortgage rates [33]. The macro frame is supportive too: Indonesian GDP growth of 5.11% in 2025, a policy rate held at 4.75%, and Bank Indonesia data showing national residential sales up 0.73% year on year [34].
The report's own regulatory table names the mechanism: Ministry of Finance Regulation 13/2025, which grants government-borne VAT on the transfer of landed houses and apartment units in fiscal 2025 within stated criteria and price ceilings. CBDK describes the effect on itself as potentially raising interest in buying residential property in its development area [35].
What the incentives actually cover
The relief has a shape. Ciputra Development, one of the four listed competitors CBDK named in its own prospectus, sets it out on a single slide: VAT exemption for houses, shophouses and apartments priced up to Rp5.0 billion per unit, exempting the VAT on the first Rp2.0 billion of value, at 100% for January to December 2026 [36]. Ciputra also discloses how much of its order intake the relief actually touches: Rp2,705 billion of its Rp9,461 billion of 2025 marketing sales were VAT-exempted units, or 28.6%, against 27.1% in 2024 [37].
CBDK's 2025 order intake breaks down differently. Of Rp430,186 million of marketing sales, Rp343,508 million — 79.9% — was commercial land plots, bare land that a housing VAT exemption does not reach. Commercial products, the shop-office and SOHO formats where some units could fall under the ceiling, were Rp83,001 million, or 19.3%. Residential was Rp3,676 million: 0.9% of the year's intake [38]. The single policy CBDK's own filing names as its regulatory tailwind applies most directly to the segment that produced under one per cent of what it sold.
That is not a criticism of the products. Commercial land sold in bulk to corporates is a legitimate and high-margin way to monetise a land bank. It does mean the national demand story that supports peer intake — mortgage rates, VAT relief, the three-million-homes programme, subsidised housing credit — is largely not CBDK's demand story, and a reader who takes the sector forecast as a proxy for CBDK's order book will be reading the wrong indicator.
The tailwind that is local
CBDK has a demand argument that does not depend on national housing policy, and it is the more relevant one. The company describes North Tangerang, where PIK2 sits, as one of Indonesia's largest property-growth centres, contributing roughly 17% of national demand, with NICE and the Hilton PIK2 hotel named as the catalysts enhancing the area's appeal [39]. Access is being rebuilt around it: the Kataraja toll road connects the PIK2 area to Soekarno-Hatta international airport [40], with two toll gates shown feeding the CBD directly [41].
The MICE venue is real and running. NICE completed at about 54,560 square metres with capacity for up to 100,000 visitors and began operating in August 2025 [42], partially operational from that month and expected to be fully operational in early 2026 [43]. The February 2026 presentation carries something closer to a demand signal than anything else in the filings: a booked calendar running from a Westlife gala on 10 February and a Michael Jackson production in April [44], through the Hammersonic festival, Java Jazz, and the Keramika Indonesia and Megabuild trade fairs in May and June [45], to a Kahitna anniversary concert and the Carabao International Open in September [46].
The industry backdrop for that pivot is the weakest part of the picture. Lippo Karawaci reports that average star-rated hotel occupancy fell to 47.21% in February 2025 from 49.45% a year earlier, with sector revenue down, and attributes part of the pressure to a contraction in MICE demand from the government sector after budget tightening on official travel and events [47]. CBDK is opening Indonesia's largest convention venue and a 271-room Hilton [48] into a hospitality market the nearest listed operator describes as contracting. A booked calendar of concerts and trade fairs is a corporate and consumer revenue base rather than a government one, which is the right side of that particular squeeze — but no filing in the corpus discloses attendance, hall utilisation, or the rate NICE charges, so the calendar is evidence of activity and not yet evidence of economics.
What the 2026 plan requires
The 2026 target makes the demand question concrete. CBDK is guiding to Rp563,054 million of marketing sales, 30.9% above 2025 realisation. The composition matters more than the total.
Source: CBDK FY2025 Annual Report, comparison of 2025 realization with 2026 projections [49].
Commercial land plots are targeted 6.0% higher and commercial products 2.5% higher. Residential is targeted at Rp114,000 million against Rp3,676 million realised — thirty-one times the 2025 outcome, and 83% of the entire planned increase in order intake [50]. Residential was also the segment that missed hardest in 2025: Rp3,676 million against a Rp10,000 million target [51].
The peer group set its 2026 targets close to 2025 realisation. Bumi Serpong Damai left its 2026 target unchanged at Rp10 trillion, describing it as a moderate view of demand [52]. Ciputra set Rp9,487 billion, 0.3% above 2025, and booked Rp2,446 billion in the March quarter against Rp3,156 billion a year earlier [53]. Alam Sutera guided to Rp2.8 trillion, 14.8% above a year in which it hit 70% of plan [54]. CBDK is guiding to the largest percentage increase in the group, concentrated in the segment where it has the least commercial history and the weakest 2025 record — and, unlike Ciputra, it publishes no quarterly order-intake figure against which a reader could mark that plan to market.
One disclosure detail belongs with the numbers. The English narrative on page 121 attributes the 95.08% achievement to residential, 60.68% to commercial land plots and 36.76% to commercial products; the Indonesian text on the same page and the target table on page 120 both assign 95.08% to commercial land plots, 60.68% to commercial products and 36.76% to residential [55] [56]. The tables govern. An English-language reader relying on the narrative would conclude that residential was the year's strongest segment when it was the weakest, and would misjudge the 2026 plan accordingly.
What would change the read
Three observable things would move this assessment materially. A half-year or full-year 2026 intake print showing commercial land plots back at the Rp300–400 billion pace of 2024 would convert 2025 into a timing gap rather than a demand break. Residential intake tracking anywhere near the Rp114,000 million target through 2026 would show the new segment is being built rather than assumed. And any disclosure of NICE utilisation, event revenue or hall rates would let the recurring-income pivot be judged on economics instead of a booking calendar.
Against that, the prospectus itself flags what would push the other way: CBDK identifies weakening consumer purchasing power as the principal risk to its business continuity, and competition for the same middle- and upper-income buyer as its main business risk [57]. Those are the risks the whole listed peer group carries. On the evidence of 2025, they are not what separated CBDK from it.
The asset behind the earnings
CBDK's inventory was Rp13,978 billion at 31 March 2026 — 62% of total assets [1] — and it is carried at what the land cost, not what it is worth [2]. Across roughly 7.0 million square metres that is about Rp1.99 million per square metre. Sales have realised 2.0 to 3.1 times that cost over three years, the same band two listed peers realised in 2025, and the current price pays about 1.84 times cost.
Sources: FY2024 Annual Report, Note 10 Inventories [3]; FY2025 Annual Report, Note 6 Inventories [4]; Q1 2026 interim statements, Note 6 [5].
Half the book sits in a single non-current line. Undeveloped land was Rp6,988 billion at 31 March 2026, 50% of inventory, against Rp6,396 billion two years earlier [6] [7]. The stock of finished product — land and buildings ready for sale — moves in a much narrower band, between nil and Rp1,153 billion, so at any moment the company holds under 9% of its inventory in a form a buyer can complete on.
The carrying value
The company discloses the area behind that money in the inventory note, and repeats it with a three-year history in the sustainability section. At 31 December 2025 it held 3,678,961 square metres of HGB-titled land ready for sale or under development and 3,341,874 square metres of undeveloped land, 7,020,835 in total [8]. That is the 702-hectare reserve, and the two-year change in it is small: 7,375,908 square metres at the end of 2023, 6,982,544 at the end of 2024, 7,020,835 at the end of 2025.
Sources: inventory from the FY2024 and FY2025 annual reports, Notes 10 and 6 [9] [10]; area from the FY2025 sustainability overview [11]; per-square-metre figures derived.
Blended carrying cost rose 8.4% over two years, from Rp1.82 million to Rp1.97 million per square metre, on an area that barely moved. That is not price appreciation — inventory is held at the lower of cost and net realisable value, and cost accumulates as predevelopment work, infrastructure, capitalised borrowing and construction go into the ground [12]. Development spending, not the market, is what moves this number.
Two features of the accounting matter for anything built on it. Cost is released to the income statement by the land-areal method, so what leaves inventory on a sale is an allocated average for the precinct, not the price paid for that specific plot [13]. And in every year of the record, including the March 2026 interim, management states that no provision for impairment is required and that no inventory is pledged as collateral [14] [15]. On a cost basis that assertion is undemanding, as the next section shows. It also means no lender has independently valued the land, because no lender has taken security over it.
The land sits across five entities. The May 2025 investor presentation maps it: PT Mega Andalan Sukses holds 413 hectares, PT Cahaya Gemilang Indah Cemerlang 123, CBDK itself 155, the NICE exhibition site 19, and PT Cahaya Kencana Indah 8 [16]. MAS alone is 59% of the reserve, and it is the subsidiary whose minority interests CBDK bought down through 2025 (Ownership and Affiliates).
What the land has realised
The record tests the carrying value directly: how much revenue each rupiah of released inventory cost has produced.
Sources: FY2023 revenue and gross profit from the FY2025 sustainability overview [17]; FY2024 from the consolidated income statement [18]; FY2025 real estate segment [19]; Q1 2026 real estate segment [20].
In FY2023, Rp966,623 million of inventory cost produced Rp1,953,493 million of revenue [21]. In FY2024, Rp976,614 million produced Rp2,248,978 million [22]. In FY2025 the real estate segment turned Rp803,680 million of cost into Rp2,464,245 million of revenue, a 67.4% gross margin [23]. In the March 2026 quarter it turned Rp86,774 million into Rp736,775 million, a multiple of 8.5 and an 88.2% margin [24].
The direction of that series is mix, not pricing power. In FY2024 the company released Rp892,969 million of buildings under construction into finished stock; in FY2025 it released Rp198,219 million [25]. Built product carries construction cost; bare land plots carry almost none. As the mix moved from houses and shop-offices to land, the multiple on cost rose mechanically. The March 2026 quarter is the extreme case: two corporate buyers, PT Global Jet Express and PT Erajaya Swasembada, accounted for Rp517,710 million, or 70% of quarterly revenue, against inventory cost of Rp86,774 million for the whole segment [26].
Set against peers, the FY2025 outcome is unremarkable. Bumi Serpong Damai's real estate segment turned Rp4,091,099 million of cost into Rp11,830,304 million of revenue in 2025 — 2.89 times, a 65.4% margin [27]. Alam Sutera Realty's property development segment ran 2.87 times and 65.2% [28].
Sources: CBDK FY2025 segment note [29]; BSDE FY2025 segment information [30]; ASRI FY2025 segment information [31].
A 66% gross margin is what an Indonesian township developer earns when it sells land it has held at cost. It is a feature of the accounting model and the industry, not a signal that CBDK's land is unusually cheap.
The peer cost base
Where CBDK does differ from both peers is the level of the cost itself.
Sources: CBDK undeveloped land and area [32]; ASRI land for development [33] and area [34]; BSDE land for development [35]; per-square-metre figures derived.
CBDK carries raw land at 3.7 times ASRI's book cost and 5.0 times BSDE's, and ASRI's land bank is itself concentrated in Tangerang — Rp5,746,184 million in Pinang and Rp4,768,820 million in Pasar Kemis, 96% of its total [36]. Two things sit behind the gap. PIK2's coastal CBD land is genuinely more valuable per square metre than inland Pasar Kemis or a thirty-year-old Serpong parcel. And CBDK's cost base is recent: BSDE and ASRI assembled theirs across decades of much lower nominal prices, which is why their books show so little of what the land is now worth.
The gap cuts both ways for an investor looking for assets carried below their value. CBDK's book is closer to current cost than a peer's, so it embeds less hidden appreciation — but it is also a book that has been marked by recent spending rather than by 1990s land prices, which makes it a more current, and in that narrow sense more reliable, floor.
What the price implies per square metre
Sources: inventory and area per the Q1 2026 interim statements and the FY2025 sustainability overview [37] [38]; equity and share count from the Q1 2026 balance sheet and Note 14 [39] [40]; realisation multiple from the FY2025 segment note [41]; share price as reported by the exchange, 23 July 2026.
The arithmetic is simple enough to check. At Rp3,760 on 23 July 2026, and 5,657,686,900 shares outstanding after the 11,257,600 held in treasury [42], the market values the equity at Rp21,273 billion. Equity attributable to owners of the parent was Rp9,506 billion at 31 March 2026 [43]. The premium is Rp11,766 billion. Spread over 7.0 million square metres, and holding every other asset and liability at book, that premium is Rp1.68 million per square metre on top of the Rp1.99 million already carried — an implied land value of about Rp3.67 million per square metre, or 1.84 times cost — before deducting net cash and the parent's share of profit still to be recognised on the advances pool, which takes the same arithmetic to 0.84 to 1.10 times cost (Backlog Run-Off).
The FY2025 realisation multiple of 3.07 times, applied to the same book, implies about Rp6.10 million per square metre of gross revenue. The distance between Rp3.67 million and Rp6.10 million is the room the case has, and four things have to fit inside it: selling and administrative expense, which ran Rp221,808 million in FY2025, or 8.9% of revenue [44]; final tax of Rp114,344 million, 4.6% of revenue [45]; the development spending still to be sunk into 3.3 million square metres of raw land; and time.
Carried cost (Rp m/sqm)
Years of book at FY2025 release rate
Price to parent book value
Sources: derived from inventory and equity in the Q1 2026 interim statements [46] [47], area from the FY2025 sustainability overview [48], and the cost of revenue released in FY2025 [49].
The arithmetic is most sensitive to the release rate. At FY2025's Rp803,680 million of inventory cost released, the Rp13,978 billion book is 17.4 years of sales. At the three-year average of Rp915,639 million, 15.3 years. At the March 2026 quarter's rate annualised, 40 years. Discounted over any of those horizons, the Rp6.10 million of undiscounted gross revenue per square metre shrinks toward — and at the slower paces through — the Rp3.67 million the price already assumes.
My read is that the land is worth more than book and that the current price is not obviously wrong about how much more — roughly a doubling of cost, against a record that says 2 to 3 times cost gross. What makes that reassuring rather than compelling is the release rate. The strongest fact against a bearish reading of it is that the book is still growing, not draining: inventory rose from Rp13,820 billion to Rp13,978 billion during the March 2026 quarter, with Rp185,571 million added to undeveloped land alone [50]. A company consuming its land bank would show the opposite. What would change the read in the other direction is a sustained rise in the realisation multiple on ordinary sales — not on quarters carried by two corporate buyers — or the first disclosure of a realised price per square metre against which Rp1.99 million of cost can be marked.
What the filings do not disclose
The corpus contains no valuation of this land. The KJPP fairness opinions that appear in the FY2025 report cover affiliated transactions, not the inventory. The one internal mark that touches PIK2 land directly is the 21 March 2025 lease of the 187,740-square-metre NICE site from PT Kukuh Mandiri Lestari, a party under common control, disclosed at a transaction value of Rp1,570,000 million for twenty years [51] — about Rp8.36 million per square metre of leasehold [52]. The rent is variable with the tenant's own profit or loss, the counterparty is the family, and a twenty-year lease is not a freehold price, so the number bounds nothing. It is worth stating only because it is the sole PIK2 land figure in the corpus set by a transaction rather than by accumulated cost.
Three further gaps are worth naming plainly:
No filing discloses the title status of the undeveloped half of the book. The inventory note describes 3,678,961 square metres of ready-for-sale and under-development land as HGB-titled; it says nothing about the 3,341,874 square metres of undeveloped land [53]. ASRI, by contrast, discloses that 10,911,378 of its 19,305,394 square metres are titled in the group's name and that the remainder sits on release letters or binding sale agreements pending gradual HGB conversion [54]. Silence is not evidence of a defect; it is an absence a reader should price as an unknown rather than as a confirmed HGB title.
No filing discloses a realised price per square metre, or the area handed over in any period. The multiple on cost is computable; the price is not.
And the area disclosure has been wrong at least once. The 31 March 2025 interim reported HGB-titled saleable land of 11,560,975 square metres [55], against 3,656,578 at the previous year end and 3,534,172 three months later [56]. The figure was corrected in the following quarter without comment. The rupiah balances in the same note reconcile across every period, so the error is confined to the area disclosure — but the area disclosure is the denominator of every per-square-metre figure on this page, including the company's own.
Watch item: the FY2026 annual report's sustainability overview, which is where the three-year land-area series is published. A change in the 7.0 million square metre reserve that is not explained by disclosed acquisitions or by the movement in inventory cost would undercut the per-square-metre arithmetic above.
Title and Permits
CBDK's land is registered and unencumbered: the IPO prospectus lists 267 building-right certificates covering 7,935,124 sqm across four group companies, every one of them recorded as not pledged. Two facts sit underneath that and appear nowhere in the accounts. Each certificate carries an expiry date, and 57.9% of the certificated area expires by the end of 2042. After minority interests, 83% of that land belongs to CBDK's own shareholders.
HGB certificates listed
Certificated area (ha)
Area expiring by end-2042
Effective share to CBDK holders
Sources: certificate schedules in the IPO prospectus [1] [2] [3] [4]; effective ownership percentages [5]. Certificate counts and areas are as at the December 2024 IPO prospectus date; the company's own inventory note reports 702.1 ha of land at 31 December 2025, 91.4 ha (11.5%) below the certificated total, and the corpus contains no means of allocating that gap across the four title-holding entities. Expiry and effective-area shares are derived.
The only parcel-level record of the land
Every chapter of this report that has priced CBDK's land — the carrying cost per square metre in Land at Cost — has worked from an area and a cost figure in the notes. The notes give one line: land and buildings ready for sale and land under development with building-right (Hak Guna Bangunan, or HGB) status measured 3,678,961 sqm at 31 December 2025, and undeveloped land measured 3,341,874 sqm [6]. The undeveloped half — 47.6% of the reserve — carries no stated title status in any period of the accounts. At 31 March 2026 the HGB-status figure was 3,626,873 sqm [7].
Section VIII.13 of the IPO prospectus answers the question the accounts leave open. It lists, certificate by certificate, every parcel legally registered to the company and its subsidiaries: number, issue date, village, area, expiry date, and encumbrance status [8]. The four schedules together total 7,935,124 sqm — more than the 7,020,835 sqm the FY2025 sustainability data reports across those same two categories [9]. The difference is not something 2025 created: the same table puts the area at 6,982,544 sqm at the end of 2024, the month the prospectus was published, and neither document reconciles certificated area to reported land area. All 267 entries carry the same note in the encumbrance column: tidak sedang dijaminkan — not currently pledged.
Sources: certificate schedules [10] [11] [12] [13]; ownership percentages at 31 March 2026 [14]. Effective area is derived.
A fifth subsidiary, the advertising vehicle ASGE, held no land or buildings at all at the prospectus date [15].
Nearly three-quarters of the certificated area sits in subsidiaries CBDK does not wholly own. Applying the effective interests disclosed at 31 March 2026 — MAS 77.35%, CGIC 78.46%, CKI 57.00% [16] — leaves 6,605,278 sqm attributable to CBDK's own shareholders, or 83.2% of the gross reserve. On the ownership levels that applied when the shares listed, when CBDK held 55.89% of both MAS and CGIC, the same schedules attributed 5,352,892 sqm, or 67.5% [17]. The three subscription rounds of 2025 examined in Ownership and Affiliates therefore bought roughly 1.25 million sqm of effective land area — the physical counterpart of the equity arithmetic set out there. Any per-square-metre figure computed on the gross reserve overstates what accrues to the listed company by about a fifth.
The expiry profile
HGB is a term right. Each certificate in the schedules carries a tanggal berakhir hak — a date on which the right ends — and those dates cluster.
Source: derived from the certificate schedules in the IPO prospectus [18] [19] [20] [21]. Row-level areas sum to 794.4 ha against the schedules' own entity totals of 793.5 ha, a difference of 0.1%.
The concentration is in two dates. A single certificate held by MAS — SHGB No. 00225, issued 31 August 2018 over Tanjung Burung — covers 2,869,168 sqm, 36.1% of the entire certificated reserve, and expires in November 2042 [22]. Four parcels registered to CBDK itself — 577,000, 472,282, 283,900 and 125,500 sqm in Kosambi Barat — expire on 21 August 2038, and with smaller parcels bring the 2038 cohort to 155.4 ha [23].
Source: derived from the certificate schedules in the IPO prospectus [24] [25].
Two clocks of similar length
The inventory book releases slowly. CBDK charged Rp803,680 million of real-estate cost against revenue in FY2025 [26] against inventories of Rp13,977,646 million at 31 March 2026 [27]. At that rate the book takes about 17 years to clear, and about 15 years at the three-year average release rate — the arithmetic worked through in Land at Cost. Counting from mid-2026, that lands between 2041 and 2043.
The expiry dates run to a similar length. By the end of 2042, the building rights over 57.9% of the certificated area will have reached their stated expiry. Inventory release and title expiry are not the same event: an expiry is a renewal obligation, not a loss of the asset.
Indonesian building rights are granted for a fixed term and are extendable and renewable, and a developer's normal course is to split the master certificate and issue individual title to each buyer well before the parent right matures. The clearest statement of that in this corpus comes from a peer with the same regime and the same regency. ASRI discloses in its own accounts that its fixed-asset land, in Tangerang and in Bali, is held under HGB with terms of 20 to 30 years maturing between 2026 and 2043, and adds that management sees no obstacle to extension because all the land was lawfully acquired and is supported by adequate proof of ownership [28].
That is the strongest fact against reading the expiry profile as a risk, and it is a strong one. What is missing is CBDK's own version of it. The audited statements for FY2021, FY2022 and FY2023 do not mention building rights at all; from FY2024 onward the inventory note gives an area and nothing else. In no period of the record does it state the term of those rights, the years in which they mature, whether extension has been applied for, or what extension costs. The note gives area and encumbrance status and stops [29]. No provision, accrual or contingent liability for title extension appears anywhere in the accounts, and no figure in this corpus sizes what extending 460 hectares of building rights would cost. That is a disclosure gap rather than evidence of a problem, and it is the reason the expiry profile above had to be built from a prospectus rather than read from a note.
The risk register does not mention land
The prospectus sets out eighteen risk factors across four categories [30] and closes with management's declaration that all risks material to the company have been disclosed and ranked by weight [31]. The list runs from weakening purchasing power and competition [32] through interest rates, raw-material availability, changing consumer preference, corporate actions, human resources, marketing capability, regulatory compliance and technology [33] [34]. None of the eighteen concerns land rights, title expiry, land acquisition or the security of the certificates. The nearest are a generic risk of failing to meet industry regulations and permits, and a generic risk of legal claims [35] [36].
Two Tangerang peers treat it differently. ASRI names disputes over land ownership rights as a legal risk that can delay development and add cost [37]. Lippo Karawaci sets out the permit stack its projects depend on — location permits and KKPR, building permits, certificates of occupancy and environmental approvals — as a named business-continuity risk [38].
The environmental approval belongs to an affiliate
The prospectus is explicit about where CBDK's environmental permission comes from. Its projects proceed by reference to the environmental approval, AMDAL and traffic-impact analysis (Andalalin) held in the name of PT KML, relying on the exemption in Article 10(1)(f) of Government Regulation 22/2021 for activities inside an area already covered by an area-level AMDAL and area-level environmental approval. Because it operates under KML's area approval, CBDK itself was required only to file a statement of capability to manage and monitor the environment, obtained through the OSS system on 18 September 2024 [39].
PT KML is the same commonly controlled party that owns the 187,740 sqm site under the NICE convention centre and leases it to IPN for twenty years at a rent that varies with IPN's own profit or loss [40], at a stated transaction value of Rp1,570,000 million [41]. Its role in the permit chain is broader than that lease and had not surfaced in the transaction analysis in Ownership and Affiliates, which records that lease: the area-level environmental consent that allows CBD PIK2 to be built sits with an entity CBDK neither controls nor consolidates, and no fee, term or termination condition for that arrangement is disclosed anywhere in the corpus. Project-level permits do sit with CBDK — the Islamic Financial Center, for instance, holds its own environmental permit, building permit and a certificate of fitness for occupancy valid to 18 March 2029 [42] — but the umbrella consent above them does not.
The location permit is the one part of the chain the prospectus treats as settled. CBDK's izin lokasi, granted by the Regent of Tangerang in 2014, covered acquisition of 399,405 sqm out of a total 1,400,000 sqm, of which 1,090,946 sqm had already been released; the prospectus records that under ATR/BPN Regulation 13/2021 no extension application is required because the company has already obtained all the land it needs for its business [43].
The litigation record
Nothing in the corpus contradicts a clean legal position. At the prospectus date the company and its subsidiaries were not party to any civil, criminal, competition, arbitration, tax, labour, bankruptcy or suspension-of-payment proceeding, and no member of either board had been involved in one [44]. The FY2025 annual report repeats it for the year then ended [45]. Set beside the encumbrance column — 267 certificates, none pledged — and the note that no inventory was used as collateral at either year end [46], the land is unlitigated and unmortgaged. For a reader whose first test is whether a claim can be forced against the asset, that combination is the substantive answer, and it is consistent with the solvency position set out in Financials and Estimates.
Two flaws in the schedules
The certificate tables are typed records and they carry typographical errors, which is worth stating before anyone reads a single row as a finding. Certificate SHGB No. 318/Tanjung Pasir, 20,785 sqm registered to CGIC, is printed with an expiry date of 26 January 2015 — ten years before the prospectus was published — while the certificate immediately below it, issued on the same day in 1981, expires in 2053 [47]. The largest certificate in the group, SHGB No. 00225, is printed as expiring 31/11/2042, a date that does not exist [48]. The row-level areas also sum 0.1% above the schedules' own entity totals. These are transcription defects of the same order as the reversed segment percentages and the corrected land-area figure already on the record; they argue for reading the expiry profile as a shape rather than as a date-accurate register.
The larger limitation is age. The schedules describe the position at the prospectus date in December 2024. Nothing in the eighteen months since — five quarterly filings, two annual reports, four presentations — restates the certificate position, updates the expiry dates, or discloses the title status of the 3,341,874 sqm of undeveloped land [49].
What would change the read
The evidence supports a plain conclusion: the asset underneath CBDK is legally held, unpledged and unlitigated, and it belongs to the listed company's shareholders to the extent of 83%, not 100%. The certificate figures behind that are as at the December 2024 prospectus: 793.5 ha, against the 702.1 ha of land the company itself reports at 31 December 2025, a gap of 11.5% that the corpus gives no means of allocating across the four title-holding entities. The expiry profile is a cost and administrative obligation concentrated in 2038 and 2042 rather than a threat to ownership, and the peer record suggests extension is routine — but CBDK has never said so in its own accounts, and no number in this corpus prices it.
Three things would move that read, and each is checkable in a specific filing.
A note in the half-year or FY2026 accounts stating the term and maturity of the group's building rights, in the form ASRI already uses, would convert the expiry profile from a derived estimate into a disclosed schedule. Its absence for a second full annual cycle would leave a Rp13,977,646 million asset described parcel by parcel in a document published at the IPO and nowhere since.
Any extension or renewal charge appearing in the cash-flow statement, in prepaid taxes, or as a new provision would be the first quantification of what the 2038 and 2042 cohorts cost. Prepaid taxes are already where land-related outflows accumulate: the Rp1,019,725 million balance at 31 March 2026 is value-added tax and Article 4(2) final tax on land and building transfers [50].
A restated certificate schedule, or an appraisal of the undeveloped 3,341,874 sqm naming its title status, would close the gap that has forced every valuation in this report to work from historic cost. The KML environmental arrangement is the related item to watch: any disclosure of a fee, term or termination right attaching to the area-level AMDAL would size a dependency currently carried at nil.
Customer Concentration
Two customers produced 69.7% of the March 2026 quarter's revenue. The larger of them — a Rp268.8 billion land sale to PT Global Jet Express — was disclosed as revenue in the nine months to September 2025, is absent from the audited full-year accounts, and appears again in the March quarter at the identical rupiah amount. The second buyer shares a commissioner with CBDK. No filing in the corpus explains either fact.
Where the March quarter's revenue came from
The three months to 31 March 2026 produced Rp742.6 billion of revenue against Rp426.3 billion a year earlier, gross profit of Rp615.9 billion [1], and Rp541.4 billion of profit attributable to shareholders, or Rp95.58 per share against Rp22.92 [2]. The quarter's 88.0% margin on land-and-building sales is the highest in the differenced record.
Note 17 to those statements names where it came from. Two individual customers each exceeded 10% of consolidated net revenue: PT Global Jet Express at Rp268,827,273 thousand and PT Erajaya Swasembada Tbk at Rp248,882,883 thousand, Rp517.7 billion together, against a nil comparative for the same quarter of 2025 [3]. That is 69.7% of the quarter's revenue and 71.5% of its Rp724.4 billion of land-and-building sales [4].
Two customers, share of Q1 2026 revenue
Combined sales (Rp million)
Trade receivables, 31 Mar 2026 (Rp million)
Sources: Q1 2026 interim statements, Note 17 [5]; statement of profit or loss [6]; statement of financial position [7].
The real estate segment released Rp86.8 billion of inventory cost against Rp736.8 billion of revenue, an 88.2% gross margin [8]. Applying that margin uniformly, the two named sales carry roughly Rp457 billion of gross profit — about three-quarters of the quarter's consolidated gross profit and 84% of the profit attributable to shareholders. The plot-level cost is not disclosed, so the split between the two buyers is an estimate; the aggregate is not.
Trade receivables from third parties stood at Rp395.6 million at 31 March 2026, down from Rp1.8 billion three months earlier [9], the quarter collected Rp278.8 billion of cash from customers [10], and advances from customers fell Rp465.2 billion to Rp9,081.7 billion [11]. Both buyers had paid before handover, out of the pool whose drawdown Financials and Estimates tracks.
The same sale in three filings
Customer concentration has only been disclosed twice in the company's published record, and the same rupiah figure carries both entries.
Sources: FY2023 audited statements, Note 15 net revenues [12]; FY2024 audited statements, Note 23 net revenues [13]; Q1 2025 interim, Note 24 net revenues [14]; H1 2025 interim, Note 24 net revenues [15]; 9M 2025 interim, Note 24 net revenues [16]; FY2025 audited statements, Note 17 net revenues [17]; Q1 2026 interim, Note 17 net revenues [18].
The nine-month note is unambiguous: "There were sales to PT Global Jet Express amounting to Rp 268,827,273 which exceeded 10% of consolidated net revenues", against nine-month revenue of Rp2,298.1 billion — 11.7% of it [19]. Three months later the audited full-year note states that "There were no sales to any individual customers which exceeded 10% of consolidated net revenues" [20], and the annual report repeats it verbatim [21]. Full-year revenue was Rp2,503.6 billion, so the 10% threshold was Rp250.4 billion and the Global Jet sale is 10.74% of the year. Had it remained in FY2025 revenue, the disclosure was required.
Three readings fit the words. The sale was recognised in the September quarter, unwound before the year end, and recognised again in the March quarter. Or it stayed in FY2025 revenue and the audited note is incomplete — in which case the Q1 2026 note repeats a sale already booked. Or the nine-month note named a sale the audited accounts do not support. Each is material: the amount is 10.7% of FY2025 revenue and 36.2% of the March quarter's.
The quarterly shape favours one reading
Interim statements are cumulative, so the individual quarters have to be differenced out. Doing that puts the fourth quarter of 2025 outside every other quarter in the record.
Sources: derived by differencing cumulative interim statements — Q1 2025 [22], [23]; H1 2025 [24], [25]; 9M 2025 [26], [27]; FY2025 [28], [29]; Q1 2026 [30], [31].
The September quarter was 44.0% of FY2025 revenue and 58.2% of the year's profit to shareholders. The December quarter was 8.2% and 3.9% — Rp205.5 billion of consolidated revenue and Rp52.7 billion of profit, against Rp1,102.7 billion and Rp794.5 billion three months earlier.
The margins move the same way. Measured as land-and-building sales less the real estate cost of revenues, the gross margin runs 55.8%, 63.3% and 78.2% through the first three quarters of 2025, then 38.4% in the fourth, then 88.0% in the March 2026 quarter. That fourth-quarter 38.4% is struck on the Rp166.7 billion of land-and-building sales, not on the Rp205.5 billion consolidated revenue line; on the consolidated basis the same fall runs from 79.0% in the third quarter to 27.8% in the fourth. Move the Rp268.8 billion sale from the third quarter into the fourth and both return to the range: the fourth quarter reads 76.4% and the third 70.8%. A reversal of a high-margin sale takes almost all revenue out and very little cost.
Source: derived from the same cumulative interim statements as the chart above, Notes on net revenues and cost of revenues [32], [33].
The money that came in during the quarter landed in advances rather than in receivables. The fourth quarter collected Rp531.4 billion from customers — the difference between FY2025 receipts of Rp2,325.6 billion [34] and nine-month receipts of Rp1,794.2 billion [35] — while advances from customers rose Rp327.5 billion, from Rp9,219.3 billion at 30 September [36] to Rp9,546.8 billion at the year end [37]. If a handover was unwound, the buyer's money simply sat back in the pool and waited for the next one.
On the balance of the arithmetic, the recognise-reverse-recognise reading is the one the numbers support: it explains the fourth-quarter revenue trough, the 38.4% land-and-building margin and the reappearing figure at once, and it moves roughly Rp181 billion to Rp237 billion of gross profit — the Rp268.8 billion sale at FY2025's 67.4% [38] and the March quarter's 88.2% segment margins [39], 12% to 16% of FY2025 group profit of Rp1,467.3 billion [40] — out of FY2025 and into FY2026. Rp268.8 billion is 5.1 times the profit the December quarter actually reported.
The strongest fact against that reading sits in the same filing. The FY2025 statements carry an unmodified audit opinion [41]; revenue recognition is the single key audit matter, precisely because "the timing of revenue recognition requires judgment on whether the Group has transferred significant risks and rewards of ownership in the inventories to the customers" [42]; and the auditor states it read the sales contracts to evaluate those timing judgments [43]. A clerical repetition in an unaudited interim note is a simpler explanation and requires no reversal at all. Nothing in the corpus uses the words cancellation or reversal in connection with any sale.
Watch item: the half-year 2026 statements, due at the end of July 2026 and not in this corpus, settle it. If Global Jet's cumulative 2026 figure is still exactly Rp268,827,273 thousand, the sale was recognised twice in two different years. If the line disappears, the March note repeated a 2025 sale in error.
The second buyer and the President Commissioner
Richard Halim Kusuma has been CBDK's President Commissioner since September 2024. The same profile page records him as a Commissioner of PT Pantai Indah Kapuk Dua Tbk since 2023 and of PT Erajaya Swasembada Tbk since 2006, in a family relationship with the President Director and Directors, and affiliated with the controlling shareholder as beneficial owner of the company [44]. The annual report's ownership section states it directly: as at 31 December 2025 he "was recorded as the ultimate beneficial owner (UBO) of the Company, indicating indirect share ownership", while holding no shares in his own name [45].
CBDK's own IPO prospectus defines an affiliate, following the capital-market law, to include a relationship between two companies having one or more of the same members of the board of directors, management, board of commissioners or supervisors [46]. On the definition the company published, CBDK and PT Erajaya Swasembada Tbk are affiliates, and the Rp248.9 billion sale is a sale to an affiliate — 33.5% of the quarter's revenue.
The Q1 2026 related-party note does not say so. Its list of related parties selling real estate is Yayasan Buddha Tzu Chi Wiyata Indonesia, PT Citra Abadi Mandiri and PT Sekarsari Aryaduta [47], and related-party advances from customers total Rp585.1 billion, Rp551.9 billion of it from PT Citra Abadi Mandiri [48]. Erajaya appears nowhere in it; the sale sits in the third-party concentration note instead [49].
The two definitions are not the same instrument. The related-party note follows the accounting standard, whose test is not reproduced anywhere in the statements, and it turns on control rather than on a shared board seat; the prospectus definition is the capital-market one, and it is the definition that governs the affiliated-transaction disclosures discussed in Ownership and Affiliates. A commissioner seat held at a listed electronics distributor since 2006 is also not evidence that the plot was mispriced: Erajaya has its own board and its own minority shareholders, and no filing in this corpus gives an area or a price per square metre for either plot. What the record does establish is narrower and still material — the largest identified sale of the March quarter was to a company connected to CBDK by a shared commissioner, and CBDK's accounts present it as a third-party transaction.
What has to replace them
The sales that produced the March quarter were booked as orders in earlier years; the orders being written now are the ones that fund later quarters. On the company's own comparison, commercial land plots — the line the company identifies as the March quarter's largest revenue contribution, up 492% year on year [50] — generated Rp343.5 billion of marketing sales across the whole of 2025, against a 2026 target of Rp364.0 billion and a total 2026 order-intake target of Rp563.1 billion [51].
Sources: FY2025 Annual Report, 2025 realisation and 2026 targets [52]; Q1 2026 interim, Note 17 [53].
Two buyers in three months took delivery of 1.5 times the commercial land plots CBDK sold in all of 2025, and 92% of everything it plans to sell in 2026. That is the arithmetic of a business releasing a backlog faster than it is writing one, and it is why the composition of the next disclosure matters more than the level of the last one.
Four things the corpus does not contain, each of which would change how much weight this quarter can bear: any buyer-level breakdown of the Rp9,081.7 billion advances pool beyond the Rp585.1 billion owed to related parties; any statement of what either company bought its plot for; any area or price per square metre for either sale; and any review or audit opinion on the interim statements that carry the concentration disclosure — the March 2026 statements were authorised for issue by the directors on 29 April 2026 [54] with no auditor's report attached.
MICE and Hotel Economics
Where the IPO proceeds went
The whole of CBDK's Rp2,295,606,434 thousand of net IPO proceeds was applied to a single subscription for new shares in PT Industri Pameran Nusantara, whose NICE building is carried at Rp2,588,619,247 thousand and has produced Rp45,208,947 thousand of revenue — 1.75% of its cost — across its entire operating life to date at a cumulative gross loss of Rp41,074,736 thousand, while on 21 October 2025 the group placed a further Rp850,000 million of cash into Danantara Patriot Bonds maturing in 2030 and 2032 at 2% per annum against its own bank borrowing cost of 6.50% to 9.00%. [1] [2] [3] [4] [5] [6].
Both deployments carry an annual cost that can be set against figures already on the page. CBDK depreciates investment property, land excepted, straight-line over 20 years [7], so NICE's building costs Rp129,431 million a year — 9.5% of the Rp1,364,252 million of FY2025 profit attributable to owners of the parent [8], against Rp45,209 million of revenue across the venue's whole operating life to date. On the bond, 2% against the 6.50% floor of CBDK's own bank borrowing cost [9] is a coupon shortfall of Rp38,250 million a year, and discounting the two tranches' contractual cash flows at that same 6.50% puts them roughly Rp184,369 million below the Rp850,000 million at which they are carried [10]. The Hilton adds a third charge: roughly Rp700 billion of the Rp800 billion investment value the February 2026 deck puts on the hotel [11] is still unspent against the Rp99.9 billion of hotel segment assets carried at 31 March 2026 [12], and that spend begins depreciating when the hotel opens in 2027.
The strongest facts against reading those two deployments as settled sit in the same filings. NICE was only partially operational from August 2025 and management expected full operation in early 2026 [13], and the booked calendar loads into the middle of 2026 [14], so no period yet observed is a fair run rate. The segment loss is also struck before any normalised land cost, because the affiliate landlord's rent varies with IPN's own profit or loss [15]. And the bond is disclosed rather than buried: it is carried at amortised cost under the group's business-model classification of financial instruments [16], the issuer is PT Danantara Investment Management (Persero), a state-owned investment manager, and the coupon, both maturity dates and the carrying basis are set out in the note [17]; the report states that fair value approximates carrying value [18], and the Group still earned Rp253,856 million of finance income in FY2025 [19].
Net IPO proceeds into NICE (Rp bn)
NICE building at cost (Rp bn)
Segment revenue since opening (Rp bn)
Cumulative gross result (Rp bn)
Sources: FY2025 Annual Report, Realization of Funds from Public Offering [20]; Q1 2026 interim statements, Note 8 Investment Properties [21]; FY2025 Annual Report, Note 22 Operating Segment [22]; Q1 2026 interim statements, Note 22 Operating Segment [23].
Gross proceeds of Rp2,301.6 billion, issue costs of Rp6.0 billion, net proceeds of Rp2,295.6 billion — the planned use and the realised use are the same single line, a subscription for new shares in PT Industri Pameran Nusantara, with nil remaining [24]. CBDK states the money was to be used by IPN "as additional funds to finance the construction project of a building" for meetings, incentives, conferences and exhibitions [25]. The listing raised money for one building.
That building now sits in investment property at a cost of Rp2,594.5 billion, of which Rp2,588.6 billion is the structure and Rp5.9 billion the land parcel [26]. Rp1,720.0 billion of it was spent during 2025 alone, and Rp2,586.3 billion moved out of assets under construction when the venue was judged ready for use [27]. NICE covers about 123,000 square metres of gross build area on a roughly 188,000 square metre site, with 54,560 square metres of exhibition halls across three buildings [28] [29]. It has been partially operational since August 2025 and, per the February 2026 deck, was expected to reach full operation in early 2026 [30].
The second leg is not built. Hilton Jakarta PIK2 is a 20-floor, 271-room hotel on the NICE site, scheduled to open in 2027, and the hotel segment "has not yet recorded any contribution to the Company's Revenue" [31]. The February 2026 deck puts its investment value at about Rp800 billion [32]. The hotel segment carried Rp99.9 billion of assets at 31 March 2026 [33], so most of that Rp800 billion is still ahead. That spend will arrive with its own depreciation.
Together the convention and hotel segments held Rp3,053.7 billion of assets at 31 March 2026 against consolidated assets of Rp22,431.2 billion — 13.6% of the balance sheet [34]. At the end of 2024 the convention segment held Rp1,188.0 billion and produced no revenue at all [35].
What the venue has earned since August 2025
The segment note has now been filed three times since NICE opened. Differencing the cumulative figures gives the operating quarters directly.
Source: derived by differencing the reported cumulative segment notes — 9M 2025 [36], FY2025 [37] and Q1 2026 [38].
As reported: the nine months to September 2025 carried Rp2,055 million of convention revenue against Rp528 million of cost [39]; the full year, Rp39,393 million against Rp46,356 million, a gross loss of Rp6,963 million [40]; the March 2026 quarter, Rp5,816 million against Rp39,928 million, a gross loss of Rp34,112 million [41]. Cumulative revenue of Rp45.2 billion is 1.75% of what the building cost.
Fourteen events were held in 2025 [42], which averages Rp2.8 billion of revenue per event. The March 2026 quarter was not empty either: the February 2026 deck names a K-pop concert at NICE on 17 January and Westlife on 10 February [43]. The quarter still produced Rp5.8 billion.
The revenue note gives a second reading of the same activity. Rental revenue rose from Rp1,008 million in 2024 to Rp35,467 million in 2025, and cost of revenues shows convention and exhibition at Rp46,356 million against nil the prior year [44]. Final tax on rental rose in step, from Rp101 million to Rp3,505 million [45] — 9.9% of gross rentals, and CBDK's policy note confirms final tax "is imposed on the gross value of transactions without taking into account the gain or loss arising from the transactions" [46]. The segment pays tax on turnover in years it loses money.
Four-fifths of the cost line is depreciation
The interim statements disclose where the depreciation lands. In the March 2026 quarter, investment-property depreciation of Rp32,385 million was charged in full to cost of revenues, with nothing in general and administrative expenses [47]. That is 81.1% of the segment's Rp39,928 million cost line. What is left — Rp7,543 million of everything else it takes to run the venue — sits against Rp5,816 million of revenue.
Sources: segment revenue and cost from the FY2025 [48] and Q1 2026 [49] segment notes; depreciation from the investment property notes [50] [51]; other cost derived as the difference.
On that basis the two periods say almost opposite things. FY2025's gross loss of Rp7.0 billion sits on top of Rp25.5 billion of positive margin before depreciation. The March quarter's Rp34.1 billion loss sits on top of a Rp1.7 billion deficit before depreciation. Margin before depreciation therefore moved from plus Rp25.5 billion to minus Rp1.7 billion, and the Rp32.4 billion depreciation charge accounts for the rest of each period's loss.
The depreciation charge itself is not yet at its full weight. CBDK depreciates investment property, land excepted, straight-line over 20 years [52]. On a building carried at Rp2,588.6 billion that is Rp129.4 billion a year, and the March quarter's Rp32.4 billion is exactly the quarterly rate [53] [54]. The whole of FY2025 carried Rp32,417 million [55] — one quarter's worth. The building only began depreciating when it left assets under construction, around the start of the December quarter, two months after NICE opened its doors. The FY2025 segment result therefore absorbed roughly three months of the asset's annual cost, not twelve.
Source: derived from the FY2025 and Q1 2026 segment notes [56] [57] and the investment property carrying value and 20-year depreciation policy [58] [59].
Covering its own cost of sales takes roughly Rp160 billion of revenue a year — about 1.7 times the rate implied by NICE's best five months, and about 6.9 times the March quarter's rate. That is before any share of the group's selling and administrative expense, before a normalised land cost, and before the hotel starts depreciating in 2027.
The land is leased, and the rent moves with the result
IPN does not own the ground under NICE. On 8 November 2024 it entered a joint operation agreement with PT Kukuh Mandiri Lestari; on 21 March 2025 the parties converted it into a lease of 187,740 square metres in Tangerang for 20 years, under which "IPN will pay the lease fee to KML with variable amount based on IPN's financial performance (profit/loss)" [60]. KML is one of the commonly controlled counterparties mapped in Ownership and Affiliates.
Two things follow from that structure. First, the 20-year depreciation life matches the 20-year lease term exactly: the building is written down to nil over precisely the period CBDK holds the right to stand on the land. Second, because the rent is wholly variable rather than fixed or indexed, no right-of-use asset appears among non-current assets and no lease liability appears among liabilities on the consolidated balance sheet [61] [62]. A Rp2,529.7 billion building stands on land the group records no obligation to pay for [63].
The same clause cuts the other way, and it is the strongest fact against reading the segment loss as the full economic picture. While IPN loses money, the rent it owes the affiliate should be low or nil, so the landlord is absorbing the start-up phase. The Rp34.1 billion March-quarter loss is struck before any land cost a third-party lessor would have charged. If NICE eventually earns money, the rent rises with it — an arrangement whose value to CBDK's minority shareholders depends on terms no filing in this corpus discloses.
What the filings do not disclose
No filing in the corpus states hall utilisation, occupancy, day rates, attendance, forward bookings in rupiah, or revenue per event. The segment note stops at gross profit — there is no segment operating result, so the marketing and administrative cost of running NICE cannot be separated from the group's.
Fixed assets rose from Rp142.6 billion to Rp442.3 billion during 2025, and the FY2025 notes contain no fixed-asset schedule at all [64]. How much of that increase is MICE equipment (depreciated over four to nine years) and how much is hotel construction is not stated.
The target-versus-realisation table sets 2026 targets for three real-estate product lines totalling Rp563,054 million, and none for the segment that absorbed the entire IPO [65].
The annual report also contradicts itself on the transaction. Under material commitments for capital goods investment it states that "the Company did not carry out any capital goods investment classified as a material transaction under the aforementioned regulation" — POJK 17/2020 [66]. The next page reports realised capital expenditure of Rp2.30 trillion, being the IPN subscription of Rp2,295,606,475,000 plus Rp99,000,000 for 99% of the hotel vehicle PT Citra Kirana Bisnis Distrik [67]. Eleven pages later the directors state that that same transaction "constitutes a material transaction as referred to in POJK 17/2020" [68]. The charitable reading is that the first passage means purchases of fixed assets rather than subscriptions for shares; the report does not say so.
Management asserts that no impairment of investment property is required and that none is pledged as collateral [69]. No independent valuation of NICE appears anywhere in the corpus — the same position the land inventory occupies in Land at Cost. No third-party mark on Greater Jakarta venue economics sits in the record either.
The ramp case, and what would settle it
Eight months is a short window, and the calendar argues that the March quarter understates the venue. The February 2026 deck lists a dense second and third quarter: The Magic of Michael Jackson on 3–5 April, Pet Adventure Wonderland on 9–12 April [70], then Hammersonic on 2 May, seven trade expos across 6–9 May, Java Jazz on 29–31 May, Keramika and Megabuild on 4–7 June and Indo Fisheries on 16–18 June [71], with a Kahitna anniversary concert on 5 September [72]. NICE was only partially operational through that period [73].
Ramp is also a documented pattern in this market rather than a hope. PWON, an IDX-listed developer that has built a mature recurring base, attributes its 2026 hospitality growth to assets moving "beyond their initial opening phase, higher occupancy and average room rates" [74]. Its recurring segments produced Rp829 billion of Rp916 billion of first-quarter 2026 EBITDA, 90% of the total [75]. PWON runs malls, offices and hotels rather than a convention venue, and no listed pure venue operator sits in this corpus, so it is a reference for what a finished recurring base looks like, not a like-for-like margin comparison.
My read on the record available: the recurring-income leg is not yet earning its capital, and the shortfall is structural rather than marginal — Rp129.4 billion of annual depreciation against Rp45.2 billion of revenue in the whole of its operating life so far, with the hotel's own charge still to come. The strongest fact against that read is the one above: the venue reached full operation only in early 2026, and its booked calendar loads into the middle of the year, so no period yet observed is a fair run rate.
The test is dated and specific. The half-year 2026 statements, due at the end of July 2026, carry the segment note. Convention revenue above roughly Rp80 billion for the six months would put NICE on a path to cover its own cost of sales within the year and make the ramp case the right one. Revenue near the March quarter's rate would leave the building consuming something like Rp136 billion a year of reported profit — against group profit attributable to shareholders of Rp1,364 billion in FY2025 [76] — for as long as it takes the calendar to fill.
Backlog Run-Off
At 31 March 2026 CBDK held Rp9,081.7 billion of customer money against product not yet handed over [1] — about 3.1 years of revenue at the March-quarter rate, against 4.5 years at the end of 2023. New orders replaced 17% of the revenue recognised in 2025, against 94% in 2024 [2]. Stripping net cash and the profit still to come out of that pool leaves a residual that values everything unsold at 0.8 to 1.1 times its historic cost.
Advances pool, 31 Mar 2026 (Rp bn)
Years of revenue covered
FY2025 intake ÷ revenue
Net cash, 31 Mar 2026 (Rp bn)
Sources: advances [3]; order intake [4]; cash and bank loans [5] [6]; coverage and replacement rate derived.
What the pool has to cover
CBDK sells before it builds. Cash arrives on contract, sits on the balance sheet as advances from customers, and becomes revenue only when the buyer takes handover [7]. That pool stood at Rp9,081.7 billion at 31 March 2026: Rp8,476.6 billion owed to third-party buyers, Rp585.1 billion to related parties, and Rp19.9 billion of rental prepayments and unallocated deposits [8].
The pool is the company's stock of already-funded revenue. Set against the revenue actually recognised, it has been shrinking as a multiple for two years.
Sources: advances from customers at 31 December 2023 [9], at 31 December 2024 and 2025 [10], and at 31 March 2026 [11]; FY2023 revenue [12]; FY2024 and FY2025 revenue [13]; Q1 2026 revenue [14]; order intake [15]. Coverage years are derived.
Two things moved at once. Revenue rose 28% across the three years, from Rp1,953.5 billion to Rp2,503.6 billion [16] [17], and the pool stopped growing: up Rp1,238.0 billion in 2024, down Rp389.7 billion in 2025, down a further Rp465.2 billion in the March 2026 quarter alone [18] [19].
The March quarter shows the mechanism cleanly. CBDK recognised Rp742.6 billion of revenue [20] while collecting Rp278.8 billion from customers [21] — a gap of Rp463.8 billion against a Rp465.2 billion fall in the pool. The two figures agree to within 0.3%, which is what makes the pool usable as an arithmetic quantity rather than a metaphor: at CBDK, revenue is very nearly the pool being drawn down.
The replacement rate
In calendar 2025 Bumi Serpong Damai grew presales 3.35% to Rp10.04 trillion, Ciputra Development fell 14.1% to Rp9,461 billion and Alam Sutera Realty fell 22.8% to Rp2,439 billion, while CBDK's marketing sales fell 79.7% to Rp430 billion. [22] [23] [24] [25] [26] The peer year is set out in Tailwinds and Peers.
Order intake — what the company calls marketing sales — is what refills the pool. Against revenue recognised, it collapsed in 2025.
Sources: order intake 2023–2025 [27]; 2026 intake target of Rp563,054 million [28]; revenue [29] [30]. The FY2026 revenue bar is the single published analyst estimate, not company guidance.
In 2023 the company sold Rp1.15 of new product for every Rp1.00 it handed over; in 2024, Rp0.94; in 2025, Rp0.17 [31]. Management's own 2026 target of Rp563,054 million does not aim at replacement either [32]: it is 20% of the only published revenue estimate for the year. On the company's own plan, the pool keeps draining.
CBDK does not disclose quarterly intake, so there is no mark on 2026 between the December year end and the half-year statements. That is the largest gap in this arithmetic, and the half-year statements close it.
What is already paid for
The useful consequence of a pre-sold model is that a large slice of future profit is not a forecast — it is a delivery obligation against cash already banked. Rp9,061.7 billion of the pool is sales advances on land plots, houses, shop-offices and warehouses [33]. Handing that product over converts it to revenue at whatever margin the mix carries.
Two margins bracket the plausible range. The FY2025 real estate segment earned 67.4% on Rp2,464.2 billion of revenue against Rp803.7 billion of released inventory cost [34]. The March 2026 quarter earned 88.2% on Rp736.8 billion against Rp86.8 billion [35] — a released cost that reads as bare land, the highest-margin product in the book. FY2025's mix is the more representative case; the March quarter is an upper bound.
Sources: advances [36]; segment margins [37] [38]; below-gross costs and the parent share held at FY2025 ratios [39] [40]. Derived arithmetic, undiscounted.
Selling and administrative expense, final tax and income tax together consumed 15.4% of FY2025 revenue — Rp221.8 billion, Rp114.3 billion and Rp49.1 billion respectively [41]. Parent shareholders took 93.0% of group profit in FY2025 [42] — a conservative anchor, since the March quarter's split was 99.1%. On those ratios, delivering what has already been paid for leaves Rp4,383 billion to Rp6,134 billion for CBDK's own shareholders, spread over roughly three to four years and not discounted here.
Setting that against the market value gives a decomposition rather than a valuation:
Sources: shares outstanding of 5,657,686,900 after 11,257,600 held in treasury [43]; cash and bank loans [44]; assets [45]. Share price as reported on the Indonesia Stock Exchange; the rest is derived.
Net cash is cash and equivalents of Rp2,745.5 billion less bank loans of Rp233.8 billion [46] [47]. The remaining book is what survives the run-off: inventories of Rp13,977.6 billion less the cost released, plus investment property of Rp2,529.7 billion, fixed assets of Rp497.2 billion, other investments of Rp1,509.8 billion and prepaid taxes of Rp1,019.7 billion, plus Rp151.8 billion of time deposits, receivables and prepayments, less Rp648 billion of payables, accruals and employee benefit obligations and less Rp2,961.3 billion attributable to non-controlling interests [48] [49] [50].
The residual divided by the remaining book gives 1.10 times at the FY2025 margin and 0.84 times at the March-quarter margin. On the stated assumptions, then, once cash and pre-sold profit are taken out, the market pays roughly one times historic cost for CBDK's undeveloped land, its convention centre and its hotel. That is a narrower premium than the headline price-to-book multiple of 2.24 times, which measures the Rp21,272.9 billion market value against Rp9,506.5 billion of parent equity [51], and it sits alongside rather than replaces the per-square-metre work in Land at Cost. Three caveats belong with it. The run-off profit is undiscounted and takes years to arrive. Below-gross costs are held at FY2025's ratio, when general and administrative expense would not fall proportionately in a genuine wind-down. And historic cost is a cost, not a market value: nothing in the corpus marks this land to a transaction.
Three intake paths
Over a long enough horizon revenue cannot exceed intake. The table below runs CBDK's own FY2025 cost structure at three sustained intake levels: gross margin at 67.4%, selling expense at 2.2% of revenue, general and administrative expense fixed at Rp166.3 billion, associate losses at Rp27.7 billion, net finance income at Rp228.3 billion, final tax at 4.6% of revenue and income tax at Rp49.1 billion [52]. Applied to FY2025's actual revenue the model returns Rp1,503 billion against Rp1,467 billion reported — 2.4% high, which is the accuracy the table carries.
Source: derived from the FY2025 cost structure [53] and FY2025 reported EPS of Rp241.45 [54]; intake levels [55] [56].
The price is most sensitive to which of those paths holds. At intake sustained near where it ran in 2025 and where management has targeted 2026, the earnings currently being capitalised are roughly five times the earnings the order book would support, and the multiple on that steady state is between 70 and 93 times. At intake back near the 2023–24 average, current earnings are close to sustainable and the multiple is 17.5 times. The pool buys three to four years to find out which it is.
Two facts weigh against reading the low path as the likely one. First, intake at CBDK is lumpy by construction: commercial land plots were Rp1,488.9 billion of 2024's Rp2,114.6 billion, and Rp343.5 billion of 2025's Rp430.2 billion [57]. A single corporate buyer can restore a year's intake — the two customer sales recognised in the March 2026 quarter alone produced Rp517.7 billion of revenue [58], more than the whole of 2025's order book (Customer Concentration). Second, the pool is not the asset. Delivering everything already collected releases only about Rp2,954 billion of the Rp13,977.6 billion inventory book at FY2025 margins — roughly a fifth [59]. Rp6,987.7 billion of undeveloped land and Rp5,494.1 billion of land under development would still be there [60]. A land bank does not have to sell on schedule; it has to sell eventually.
The read the evidence supports is that the low path is a floor on reported earnings power rather than a forecast, and that the residual multiple of 0.84 to 1.10 times cost is the more durable anchor than any near-term P/E. What would move it: an intake print near or above Rp1.0 trillion for the first half of 2026 would put the replacement rate back in a range where current revenue is defensible; a first half near Rp0.2 trillion would confirm the Rp563 billion full-year target as the ceiling rather than the base.
Where the balance sheet can and cannot break
CBDK's liabilities are almost entirely a promise to build, not a promise to repay. Of Rp9,963.5 billion of total liabilities at 31 March 2026, Rp9,081.7 billion — 91.2% — is advances from customers, and bank loans are Rp233.8 billion against Rp2,745.5 billion of cash [61] [62]. On the filed record there is no maturity wall and no lender able to force the issue; the solvency detail sits in Financials and Estimates.
The constraint is slower and runs through cash. Free cash flow — operating cash flow less purchases of fixed assets and investment properties — was minus Rp592.0 billion in FY2025, on Rp719.4 billion of operating cash flow against Rp1,311.4 billion of capital spending [63], and minus Rp257.0 billion in the March 2026 quarter, on minus Rp130.9 billion of operating cash flow and Rp126.1 billion of capital spending [64]. At the FY2025 rate the cash balance funds about four and a half more years; at the March-quarter rate, about two and a half. Neither is a near-term insolvency risk, and the March-quarter buyback (Financials and Estimates) indicates management does not treat the balance sheet as tight. The burn is nonetheless real, and it runs against a pool that is no longer being refilled.
What the next filings settle
The half-year 2026 statements are due at the Indonesia Stock Exchange at the end of July 2026, with the earnings calendar carrying 29 July 2026. Four line items in that filing are checkable against thresholds this chapter has set.
Advances from customers at 30 June 2026 (Note 11). Another quarter of the March-quarter drawdown puts the pool near Rp8.6 trillion and the coverage ratio under three years. A flat or rising balance means new orders arrived without being disclosed as quarterly intake.
Receipts from customers in the cash flow statement against revenue recognised. A second consecutive period of receipts below revenue confirms the crossover as a trend rather than the single data point it currently is.
First-half marketing sales against the Rp563,054 million full-year target. Above roughly Rp1.0 trillion the replacement rate is repairable; near Rp0.2 trillion the 2025 rate is the base case.
Whether the Rp268,827,273 thousand PT Global Jet Express line, disclosed in the March 2026 concentration note, reappears at the same amount in the cumulative first-half figure. If it does, the same sale has been recognised in two different years.
The fourth of those is checkable to the rupiah, because the amount is exact: Rp268,827,273 thousand is the figure the March 2026 note attributes to PT Global Jet Express [65], and the same figure appears in the nine-month 2025 note but not in the audited FY2025 one (Customer Concentration).
Beyond that filing, the FY2026 annual report — due around April 2027 — carries the target-versus-realisation table for 2026 and the 2027 target, which is where management's own view of the replacement rate becomes visible again.
Three things this chapter could not resolve. There is no external mark on the land: no appraisal, transacted price per square metre or broker valuation for the CBD PIK2 district exists anywhere in the corpus, so the remaining book is priced against its own cost. There is no buyer-level breakdown of the Rp9,081.7 billion pool beyond the Rp585.1 billion owed to related parties [66], so the concentration of the run-off is unknown. And the corpus holds filings and market price data only: it contains no 2026 broker commentary and no half-year press reporting to set against the filed record.